 |
Visit to Ambleside MAPS & DATA 6-11 June 2013 | |
| Where ? Maps Heights Figures Timing Tracks Extra Postscript Read Me |
Features of Our Walks
On our away break we aimed for some typical medium level Lakeland walks, without necessarily making for the highest peaks. Admittedly, we reached over 850 metres on our Fairfield walk and almost got to 800 metres on our "Old Man of Coniston" walk, so we got in some nice exercise and scenery. Whilst our Langdales, Troutbeck and Sweden Bridges walks reached lower levels, we still managed to get the crunch of slate under our feet on all five days - June 06 to 10. An excellent Lakeland experience!

Here we start our descent from the top of the Fairfield Horseshoe down to Ambleside.
Now prepare ye for some plots and graphs. Not too overwhelming, but hopefully quite interesting!
How far is Ambleside from the Centre of London?
Our point of reference in Ambleside was the doorstep of our hostel, the start and endpoint of some of our walks. Our doorstep was about 234 miles or 376 Km NNW of the centre of London. These figures are based on a bit of Spherical Geometry, taking the centre of London as the intersection of The Strand, Whitehall and Cockspur Street. This intersection is often referred to as Charing Cross, not to be confused with the nearby Victorian Eleanor Cross itself, nor with the station in front of which the cross stands. The detailed figures, for the fun of it, are as shown below the outline map of the British Isles.
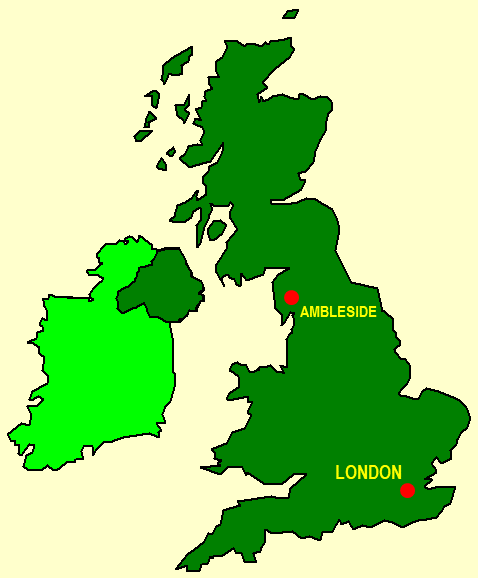
In Ambleside we were about 234 miles NNW of the centre of London.
Please see "Attributions".
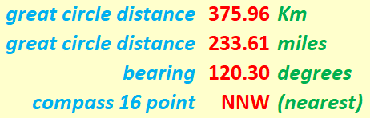
Here are "chapter and verse" on our location related to London.
Essentially we are looking at the distance on a great circle of the earth, assuming the earth to be spherical, which is not far off the mark. Assuming the earth to be a sphere gives us an error of about 0.1% in our distance value. Not that much really! Can't complain! Indeed, we can speak of the distance as the "hypothetical crow" (cornix hypothetica) flies.

Cornix Hypothetica, our hypothetical crow,
isn't any old bird, as we should know.
Cornix Hypothetica! Many miles you fly,
drawing our "straight lines" across the sky.
Outline Maps of Our Walks
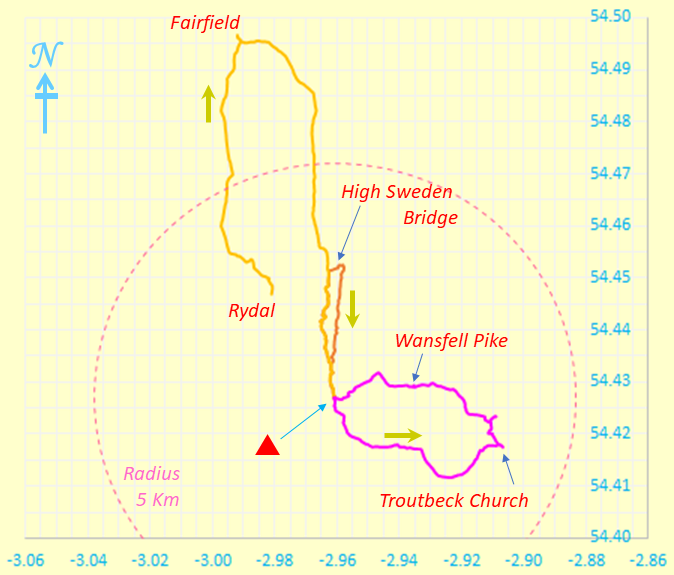
Three of our walks were focussed on our hostel in Ambleside, denoted by the red triangle in the two maps. Two of these walks, to the Sweden Bridges (June 06) and to Troutbeck (June 10) were circular, and the Fairfield Horseshoe (June 08) almost so. The other two walks, The Langdales (June 07) and Coniston (June 09), were also circular. Their respective starting points were about 10 Km from our doorstep, but we could reach these starting points by using the well run local bus services radiating out of Ambleside bus station.
I find that it's nice to put some figures to the walks that we did. So when I got home, I set about plotting the course of each of our walks using the Bike Hike app on the web. I tried to be as accurate as possible with the plots, but of course, as always, I would not guarantee perfection! I am human after all, and maps, however good, can make approximations to what is actually on the ground. From the plots I got heights, gradients, distances and a host of other intriguing information. These parameters helped me to compare the physically demanding aspects of the walks. Note, of course, that in mountainous areas, a short walk of 7 to 10 miles could, because of the heights involved, turn out to be more strenuous than, for example, a 16 mile walk on the flat.
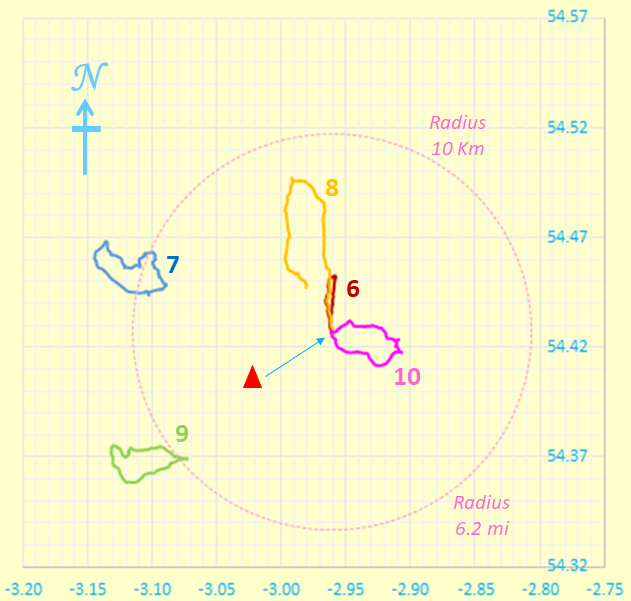
Here is a cartographical summary of All Our Five Walks.
These walks were roughly within 10 Km (6.2 miles) of our hostel in Ambleside.
The end points of our three local walks were the doorstep of our hostel,
from which we actually started on two of our "local" walks.
The map grid scales translate to 1.112 Km per 0.01° latitude and a mean of 0.647 Km per 0.01° longitude (WGS84 standard), both when using 6371.0 Km as the volumetric mean radius of the earth. It is interesting to compare the present longitude distance-to-degree ratio with that for other walks. It you do this, you will see that the further north you go, the less kilometres per degree longitude you get. Once you get to the Lake District the reduction in this ratio compared to that for walks in the south-east of England is quite noticeable. For example, in Guildford (south west of London), we already have a slightly larger value of 0.697 Km per 0.01° longitude - an extra 50 metres per 0.01° longitude (or 5 Km per degree longitude!) when compared with Ambleside in the Lake District.
Because we don't live on a flat earth - unless you are a convinced "flat-earther" - maps are inevitably a distortion of what is. In other words, it's all a matter of mapping a curvaceous surface onto a flat surface. We don't want to carry curvaceous representations of the terrain on our walks, do we? In our case, the northern length of our map grid (first larger scale map, above, of our five walks) is stretched out by something like an extra 0.61 %, (i.e. still below 1%) to make it the same on the page as the length of the southern part of our map grid. Not that much for hiking purposes really! Can't complain!
Height Profiles of Our Walks
For the height profiles below, each walk is denoted by the day (June 6, 7, 8, 9 and 10) on which it took place. (Incidentally, the OS® map invariably gives a slightly greater height for a mountain peak - typically by 10 to 20 metres - than the plot of the walk would indicate; while this could point to inexperience on my part, it could also be that the OS map refers to the highest point, even if that point be a man-made structure). Distances, as always, are at sea level (the U.K. mean sea level as defined by the OS). Of course, the old wisdom rings true: distances that seem short on the flat actually can be quite significant in mountainous areas.
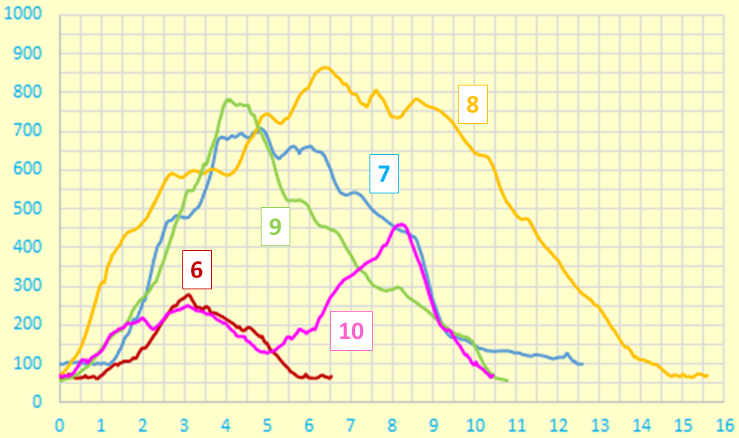
Height Profile. This plot uses a true origin for the vertical elevation (height) axis, so as not to lose track of reality. What a worthy aim!
The official heights (as given by the OS®) of the mountains in the Lake District fall a bit short of the one kilometre mark, but our walks got reasonably close to that level. In that respect, we certainly had a good "run" (or should I say "walk") for our money! The other aspect that the diagram aims to show for each walk is the "steepness" of the gradients and the distance or length over which each gradient endures. Soak up the visual impact!
The clockwise route of the Fairfield Horseshoe in the Lake District has a total distance of 15.62 Km (9.71 miles), with the following calculations: an average rising gradient of 14.66% over 6.589 Km, a level part over 0.345 Km (variations not exceeding 0.5 metres in height), and an average falling gradient of 11.11% over 8.676 Km.
The average gradients and the distances over which they endure are, as expected, generally higher than those expected in day walks in the South-East. By comparison, Hertfordshire County Council recommends that its roads should not have longitudinal gradients of more than 5% and one of the steepest adhesion railways in the world, in Austria, has a maximum gradient of 11.6%.
Some Facts and Figures
Here are some "vital statistics" in metric and imperial units. The total length of each walk is measured on the surface of the WSG84 spheroid. However, we can consider this, without undue loss of accuracy, as being on a conceptual "flat" plane at mean sea level, using the OS sea level reference referred to above and as explained on OS "hiking" maps. There you are!
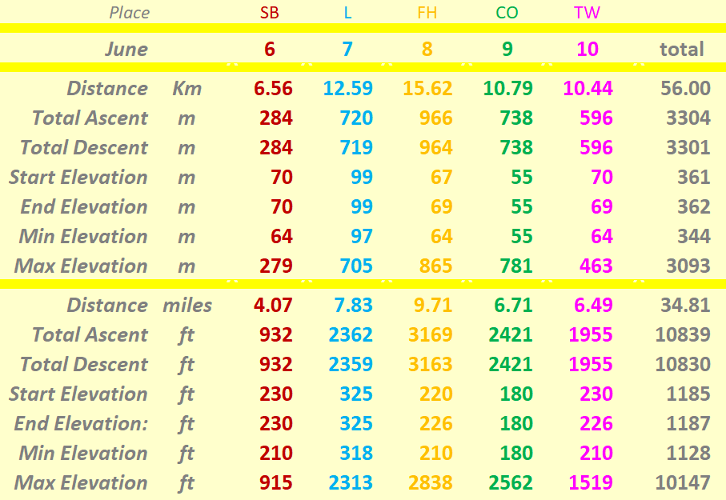
"Walk facts and figures"
It's of course fine to say that, for example, on our Fairfield Horseshoe walk we reached about 865 metres above sea level and descended to 69 metres above sea level (i.e. a height difference of 796 metres), but what's the significance of that? Probably, of greater interest when it comes to considering personal achievements, is the total ascent. On this particular walk, the total ascent was 966 m, which as expected, was greater than the difference of 796 metres between maximum and minimum heights above mean sea level. It's the total ascent which gets closer to being a measure of our fitness, rather than the maximum height reached.
Less Quantifiable Considerations
On any walk there are considerations which are very real but tantalizingly out of ready reach of those who wish to espouse a numerical approach to many of life's activities. Here are three considerations for starters.
- Weather: As the pictures show, we had good walking weather with plently of sunshine on all days except for some cloud and haze at higher levels on our Coniston and Troutbeck walks. In noway did the weather make incursions into our "walking plans". No doubt, the enthusiastic could trawl web records of the prevailing temperature and humidity readings, but I'm sure we can continue here without them!
- Ground Conditions: It was not very muddy - certainly not enough not enough to impede our progress.
- Signposting: This was mainly of the nature "here's a footpath" or "here's a bridleway". However, we had OS maps to tell us where we were headed.
Timing and Speed
It's one thing to discuss the terrain over which we walk. It's quite another to ask how we personally respond to walking over that terrain. There are a number of considerations, of which timing and speed can be taken as starting points, should you wish to wax enthusiastic in these areas!
- Timing: I admit that I spent more time enjoying the walks rather than timing them precisely! However, we finished all walks quite comfortably within daylight hours!
- Speed: Our walking speeds, excluding lunch breaks and photographic stops, were about 2 to 2½ mph.
Track Files
If you are keen to see our walks superimposed on an Ordnance Survey® (OS) map or on another system such as Google Maps®, then you can use the following five files for June 06, 07, 08, 09 and 10 respectively, to do so.
Postscript
Any map is an approximate representation of what is. Practicality and scale are relevant considerations. We are not dealing with a planning application calling for detailed spatial descriptions of intricate boundaries. For us in the hiking community, the degrees of accuracy and precision should be just enough to give us useable and helpful knowledge of the terrain about us and beneath our feet. I hope my humble endeavours on this page are in this respect interesting for, and useful to, you my reader!
Attributions
On this page, the outline map of the British Isles and the picture of the globe are both from the Microsoft® PowerPoint® Clip Art Libraries originally supplied with versions of MS_Office®.
Eric Scharf
Original: 2016-08-26 @20:24
Last Update: 2019-03-11 @19:52
SAGAX REX HANC RETIS ORBIS PAGINAM PINXIT ANNO MMXVI ET MMXIX.
© Eric Scharf 2016 & 2019