 |
Wray & Windermere WALK FEATURES CLOG: 16th April 2017 |
|
| Where ? Map Heights Figures Timing Track Extra Finally Google® Read Me |

Features of Our Walk
Our 10 mile (16 Km) walk today mainly followed the western shoreline of Windermere (lake) at 40 m above sea level (ASL). However, in the afternoon, we reached almost 240 m ASL, getting good east-facing views as a reward. and enjoying the Lakeland terrain - with its mixture of birches, confers and ferns and with crunchy slate underfoot. Because of the misty weather today, we decided not to go too high into the mountains, being content to see them more safely from a lower level. Nevertheless, our walk was scenic and also had a dose of history.
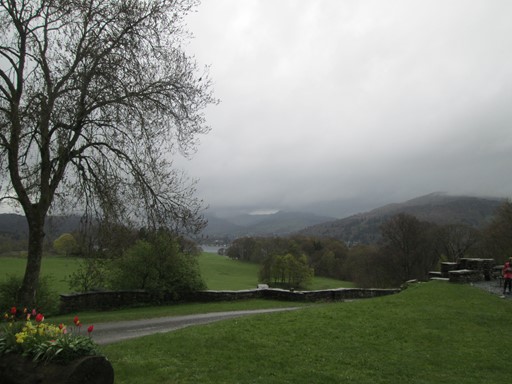
The north-facing view from Wray Castle is impressive, even in the mist.
Now prepare ye for some plots and graphs. Not too overwhelming, but hopefully quite interesting! You will see here:
- How far were we from the Centre of London?
- Outline Map of Our Walk
- Height Profile of Our Walk
- Some Facts and Figures
- Less Quantifiable Considerations
- Timing & Speed
- Track File
- And Finally
- Please Read Me! Thankyou!
How far were we from the Centre of London?
Our point of reference in Ambleside was the doorstep of our hostel, the start and endpoint of some of our walks. Our doorstep was about 229 miles or 368 Km NNW of the centre of London. These figures are based on a bit of Spherical Geometry, approximating to the spheroid defined by the WGS84 - World Geodetic System. We take the centre of London as the intersection of The Strand, Whitehall and Cockspur Street. This intersection is often referred to as Charing Cross, not to be confused with the nearby Victorian Eleanor Cross itself, nor with the station in front of which the cross stands. The detailed figures, for the fun of it, are as shown below the outline map of the British Isles.
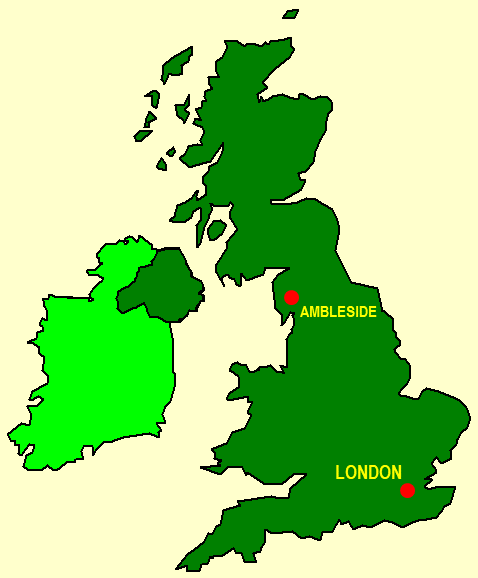
In Ambleside we were about 229 miles or 368 Km NNW of the centre of London.
Outline map from Microsoft® Clip Art Library originally supplied with MS Office®.
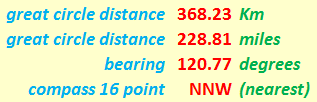
Here are "chapter and verse" on our location related to London.
Our "straight line" distances are actually "great circle" distances on the earth's surface. As mentioned above, we assume the earth to be spherical, which is not far off the mark. Assuming the earth to be a sphere gives us an error of about 0.1% in our distance values. Not that much really! Can't complain! Indeed, we can speak of the distances as the "hypothetical crow" (cornix hypothetica) flies.

Cornix Hypothetica, our hypothetical crow,
isn't any old bird, as we should know.
Cornix Hypothetica many miles for us can go,
with many a "straight line" o'er Earth to show.
Outline Map of Our Walk
Our walk was roughly north-south with two loops. A lot of the walk followed the shoreline of Windermere (lake). Our route used a combination of off-road footpaths and lightly used tarred access/side roads. At 10 miles (16 Km) it was a relaxing Sunday walk with only a modest total ascent.
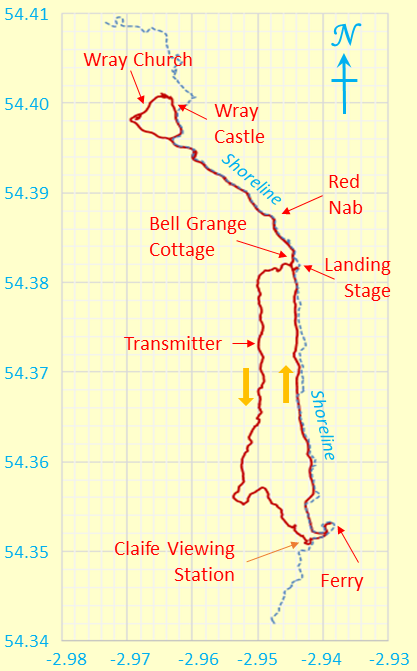
Outline Map of Our Walk.
Degrees Latitude and Longitude feature on the Y and X axes respectively.
The map grid scales translate to 1.112 Km per 0.01° latitude and a mean of 0.648 Km per 0.01° longitude (WGS84 standard), both when using 6371.0 Km as the volumetric mean radius of the earth. It is interesting to compare the present longitude distance-to-degree ratio with that for other walks. It you do this, you will see that the further north you go, the less kilometres per degree longitude you get. Once you get to the Lake District the reduction in this ratio compared to that for walks in the south-east of England is quite noticeable. For example, in Guildford (south west of London), we already have a slightly larger value of 0.697 Km per 0.01° longitude - almost an extra 50 metres per 0.01° longitude (or 5 Km per degree longitude!) when compared with Ambleside in the Lake District.
Because we don't live on a flat earth - unless you are a convinced "flat-earther" - maps are inevitably a distortion of what is. In other words, it's all a matter of mapping a curvaceous surface onto a flat surface. We don't want to carry curvaceous representations of the terrain on our walks, do we? In our case, the northern length of our map grid is stretched out by something like an extra 0.17 %, to make it the same on the page as the length of the southern part of our map grid. Not that much for hiking purposes really! Can't complain.
Height Profile of Our Walk
In the afternoon, on the upper path (high road), we reached our highest point at 239 m (784 ft) - as per our "Facts and Figures" just below. This, of course, is compatible with our total ascent of 528 m (1732 ft). Indeed, it's the total ascent which gets closer to being a measure of our fitness, rather than the maximum height reached.
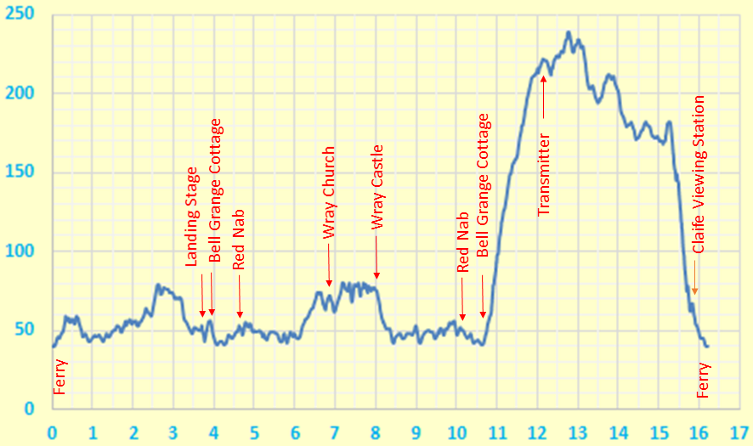
Height Profile
Some Facts and Figures
Here are some "vital statistics" in metric and imperial units. The total length our walk is measured on the surface of the WSG84 spheroid. However, we can consider this, without undue loss of accuracy, as being on a conceptual "flat" plane at mean sea level, using the OS sea level reference as explained on OS "hiking" maps. There you are!
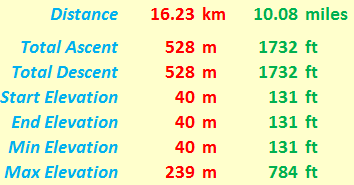
"Walk facts and figures"
Less Quantifiable Considerations
On any walk there are considerations which are very real but tantalizingly out of ready reach of those who wish to espouse a numerical approach to many of life's activities. Here are three considerations for starters.
- Weather: As the pictures show, our weather was misty with a bit of rain, but not enough to deter enterprising CLOGgies! We were able to appreciate the "misty" landscape!
- Ground Conditions: We hardly encountered any mud, even in the afternoon on the upper path.
- Signposting: This was mainly of the nature "here's a footpath" or "here's a bridleway". However, we had OS maps to tell us where we were headed.
Timing and Speed
It's one thing to discuss the terrain over which we walk. It's quite another to ask how we personally respond to walking over that terrain. There are a number of considerations, of which timing and speed can be taken as starting points, should you wish to wax enthusiastic in these areas!
- Timing: Our walk started at about 11:00 and finished at about 17:30 with a total stop time of about two hours:
- at Wray Castle for lunch and "sightseeing" and
- for taking pictures on the actual walk.
- Speed: With a total distance of 10 miles, this yielded about (10/(4.5)) mph or 2.2 mph. This is a "normal sort of" walking speed, which, as I'm sure you'll agree, is quite acceptable for those of a CLOGgie calibre. Of course, whilst fitness is relevant, we also wanted to enjoy the socializing, the walk, the landscape and the history! All of which we did!
Track File
If you are keen to see our walks superimposed on an Ordnance Survey® (OS) map or on another system such as Google Maps®, then you can use this file to do so. The data are based on WGS84. Of course, for copyright reasons, I do not show the OS-based or Google-based maps here.
And Finally
Any map is an approximate representation of what is. Practicality and scale are relevant considerations. We are not dealing with a planning application calling for detailed spatial descriptions of intricate boundaries. For us in the hiking community, the degrees of accuracy and precision should be just enough to give us useable and helpful knowledge of the terrain about us and beneath our feet. I hope my humble endeavours on this page are in this respect interesting for, and useful to, you my reader!
Appendix: Google® Map
Here you will see a Google® view at a height of 3.370 Km of the area around Windermere (lake). In order to explore the wider area, you can of course
- alter the height and thus the detail (+ -),
- toggle between "Satellite" and "Map" view, and
- use your cursor to move to a particular area of interest.
Eric Scharf
Original: 2020-11-14 @15:10
SAGAX REX HANC RETIS ORBIS PAGINAM PINXIT ANNO MMXVII.
© E. Scharf 2020