 |
Waterbeach to Anglesey Abbey MAPS HEIGHTS 8th June 2019 |
|
| Where ? Map Heights Figures Extra Timing Track Finally Read Me |

Features of Our Walk
This walk measures 4.79 miles between Waterbeach Station and Anglesey Abbey. We took the same route in reverse when returning in the afternoon. We were out in the fens, so it should not come as any surprise that maximum and minimum heights were 15 and 2 metres (49 and 7 feet) respectively. This walk was devised and ably led by Julie. In the morning we had wind and rain, but these cleared up in the afternoon.
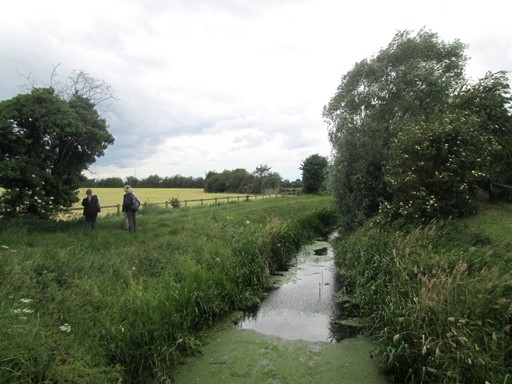
The path between Waterbeach Station and Anglesey Abbey took us through what is probably a very typical fen landscape. We experienced "un-ending" wide-open spaces, occupied by level fields and criss-crossed by numerous water courses.
Now prepare ye for some plots and graphs. Not too overwhelming, but hopefully quite interesting! You will see here:
- An Outline Map of Our Walk
- Height Profile of Our Walk
- Some Facts and Figures
- Extra, Less Quantifiable, Considerations
- Timing & Speed
- Track File
- And Finally
How far were we from the Centre of London?
We started our walk at Waterbeach Station (Network Rail Code: WBC) and in the morning we finished our walk at Anglesey Abbey. In the afternoon, we did the same walk in reverse. Since the platforms at Waterbeach Station are staggered, we regarded the start and end points of our walk as being at the centre of the level crossing, which separates both parts of the station.
Waterbeach Station and Anglesey Abbey are respectively about 54 miles and 53 miles NNE from the centre of London. The centre of London is officially taken as the intersection of The Strand, Whitehall and Cockspur Street. This intersection is often referred to as Charing Cross, not to be confused with the nearby Victorian Eleanor Cross itself, nor the station in front of which the cross stands. The detailed figures, for the fun of it, are as shown below.
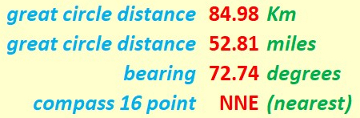
Anglesey Abbey is about 53 miles from the centre of London.
Our "straight line" distances are actually "great circle" distances on the earth's surface. We assume the earth to be spherical, which is not far off the mark. Assuming the earth to be a sphere gives us a maximum error of about 0.1% in our distance values. Not that much really! Can't complain! Indeed, we can speak of the distances as the "hypothetical crow" (cornix hypothetica) flies.

Cornix Hypothetica, our hypothetical crow,
isn't any old bird, as we should know.
Cornix Hypothetica! Many miles for us you go,
with many a "straight line" o'er Earth to show.
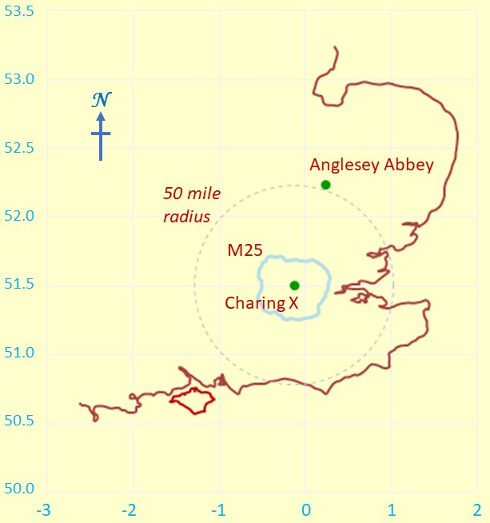
Anglesey Abbey is just over 50 miles from the centre of London (Charing X NOT King's X).
Degrees Latitude and Longitude feature on the Y and X axes respectively.
Outline Map of Our Walk
Here you see half of our "linear" walk. The routes of our morning and afternoon walks were the same, but obviously in opposite directions! The map grid scales translate to 1.112 Km per 0.01° latitude and a mean of 0.681 Km per 0.01° longitude, all when using 6371.0 Km as the volumetric mean radius of the earth - as per the WGS84 standard! In Scales, in the Lake District, the longitude scale is less (as expected), with a mean of 0.644 Km per 0.01° longitude; in fact, it is 37metres per 0.01° longitude less than in Waterbeach!
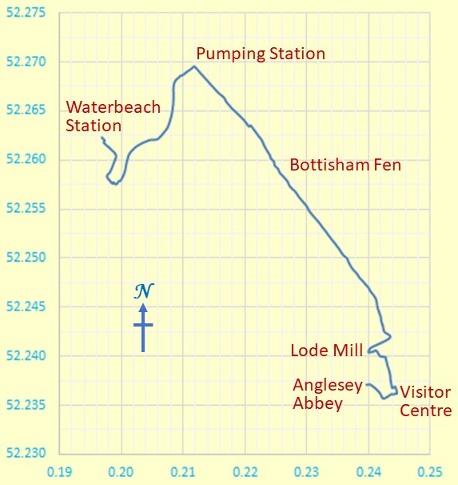
Outline Map of Our Walk
Y and X axes are in degrees latitude and longitude respectively.
Because we don't live on a flat earth - unless you are a convinced "flat-earther" - maps are inevitably a distortion of what is. In other words, it's all a matter of mapping a curvaceous surface onto a flat surface. We don't want to carry curvaceous representations of the terrain on our walks, do we? In our case, the northern length of our map grid is stretched out by an extra 0.10 %, to make it the same on the page as the length of the southern part of our map grid. Not that much for hiking purposes really! Can't complain.
Height Profile of Our Walk
The height plot shows that we were close to sea level. The plot uses a true origin for the vertical elevation (height) axis, so as not to lose track of reality. What a worthy aim!
The on-line plotting sytem puts the height data with the resolution of three decimal places into the gpx file that it generates. However, it knocks the three decimal places off the height data that it presents in a text file to the user; this, of course, distorts the distance versus height plot. To regain the appropriate resolution of the height data, the following steps were required.
- I had to convert the gpx file, using Notepad® and Word®, to create the table (with over 700 entries) of longitude, latitude and heights (the latter now to three decimal places!).
- From the longitude and latitude readings, I then generated the distances, using the Vincenty formula, independently of the on-line plotting system. What fun!
Of course, we did a return walk, in the afternoon, using the same route. So, what you see is the outward (morning) walk.
The red line is a moving average trendline fit using a 6th order polynomial. This tries to foster an appropriate interpretation of the height plot.
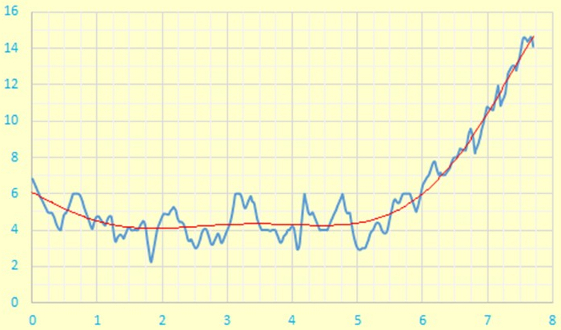
Height Profile
X and Y axes are in units of metres and kilometres respectively.
In the above plot, Waterbeach Station is on the left and Anglesey Abbey on the right. The "ey" in "Anglesey" indicates "island". This is borne out by the height plot. In the low-lying fens, an island would have been an appropriate location in which to build a priory. "Angle" may derive from the Angles who were one of the main Germanic peoples who settled in Great Britain after the Romans left. There is probably not a direct etymological link with the Welsh island of Anglesey.
Some Facts and Figures
Here are some "vital statistics" in metric and imperial units. The total length of the walk is measured on a conceptual "flat" plane at mean sea level, WGS84 style. The total ascent should normally exceed the difference between maximum and minimum elevations. The fact that this is not the case here may be because we are at the limit of resolution of the elevation data available from the on-line plotting system.
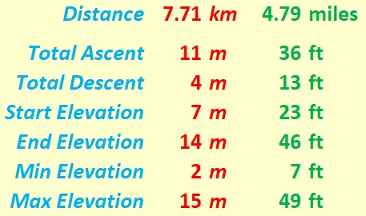
"Walk facts and figures"
Extra, Less Quantifiable, Considerations
On any walk there are considerations which are very real but tantalizingly out of ready reach of those who wish to espouse a numerical approach to many of life's activities. Here are three considerations for starters.
- Weather: Whilst it was gusty and rainy in the morning, these conditions cleared up by the afternoon. The temperature throughout our visit was about 17°C; this was good for walking.
- Ground Conditions: There was no mud.
- Signposting: The paths were adequately signposted.
Timing and Speed
It's one thing to discuss the terrain over which we walk. It's quite another to ask how we personally respond to walking over that terrain. There are a number of considerations, of which timing and speed can be taken as starting points.
- Timing: Each part of our walk took about two hours.
- Speed: The distance of each part of the walk was about 4.79 miles. This gave an average speed of about 2.4 mph, which is acceptable on the flat terrain of the fens.
Track File
If you are keen to see our walk superimposed on an Ordnance Survey® (OS) map, then you can use the following file to do so. The numerical data in this file were recorded on my GPS (Garmin®). The data are based on WGS84. Of course, for copyright reasons, I do not show the OS-based map here. Furthermore, the plot may also include some walkabouts in hostelries and sightseeing places; hence there may be a slight over estimation of the length by perhaps 0.5 Km.
And Finally - a Matter of Practicality
Any map is an approximate representation of what is. Practicality and scale are relevant considerations. We are not dealing with a planning application calling for detailed spatial descriptions of intricate boundaries. For us in the hiking community, the degrees of accuracy and precision should be just enough to give us useable and helpful knowledge of the terrain about us and beneath our feet. I hope my humble endeavours on this page are in this respect interesting for, and useful to, you my reader!
Eric Scharf
Original: 2019-06-12 @19:39
Latest: 2020-07-15 @10:05
SAGAX REX HANC RETIS ORBIS PAGINAM PINXIT ANNO MMXIX ET MMXX.
© Eric Scharf 2019 & 2020