
|
Brecon Beacons - Wern-Watkin MAPS & DATA IVC - May 2008 |

|
| Where ? Walk Map Heights Figures Weather Track Finally Google® Read Me |


Features of Our Walk from Wern-Watkin
Our walk you see described here was circular, starting and ending at the Wern-Watkin bunkhouse which is in the hills south of Crickhowell in the Brecon Beacons. The walk occupied the "high ground", the track staying roughly between 300 to 500 metres (or approximately between 1000 and 1700 feet). This implied a total ascent of only about 600 metres, so we had a reasonably easy 13½ miles of distance under our feet. We had good views, especially towards the east to Gilwern and Abergavenny.
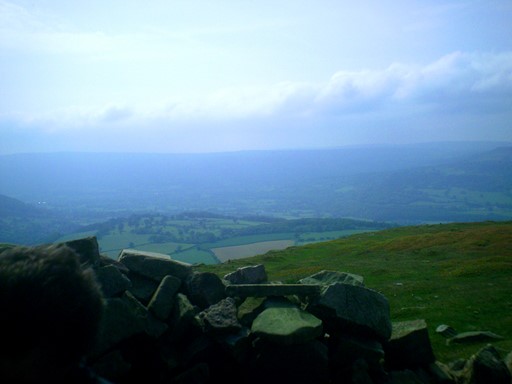
We enjoyed good views from the top.
While I did not have precise records of this walk, there are a number of aspects which led me to the route described below - a route I resurrected by plotting a GPX file using "bikehike.co.uk". These aspects include:
- the pictures of our party on the high ground,
- the pictures of the green valley towards the end of our walk,
- the fact that we were going "round the mountain", which I take to be "Mynydd Llangatwg", and last, but not least,
- the distance of 13½ miles given by David who had planned the walk, the course of which I subsequently plotted 12 years later!
Now prepare ye for some plots and graphs. Not too overwhelming, but hopefully quite interesting! You will see here:
- Where is Wern-Watkin?
- An Outline Map of Our Walk
- Height Profile of Our Walk
- Some Facts and Figures
- Weather, Ground Conditions & Signposting
- Timing & Speed
- Track Files
- And Finally
- Appendix: A Google® View
Where is Wern -Watkin?
The Wern-Watkin Bunkhouse is in the Brecon Beacons and, at the same time, in the Welsh county of Powis. Wern-Watkin is about 131 miles in an approximate west direction from the centre of London, as the crow flies. The centre of London is officially taken as the intersection of The Strand, Whitehall and Cockspur Street. This intersection is often referred to as Charing Cross, not to be confused with the nearby Victorian Eleanor Cross itself, nor the station in front of which the cross stands. The detailed figures, for the fun of it, are as shown further below.
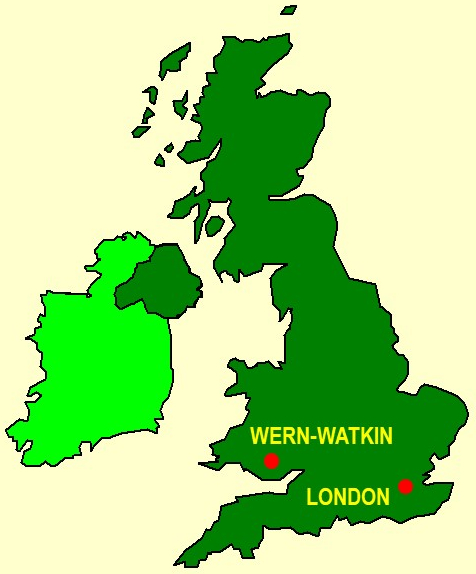
Here you see a "sketch" of the U.K. showing the approximate locations of Wern-Watkin and London.
This "map" is from the Microsoft® PowerPoint® Clip Art Library originally supplied with versions of MS_Office®.
If you espouse the quantitative in life, we have some numbers for you! What are these "great circle distances"? If you haven't met these before, I'll try, in my humble way, to give a little bit of an explanation. A great circle is the largest circle that can be drawn on the surface of a given sphere. As a consequence, its centre coincides with the centre of the sphere. We assume the earth to be spherical. It makes our maths "reasonably" easy and gives us a maximum error of about 0.1% in our distance values. Not that much really! Can't complain!
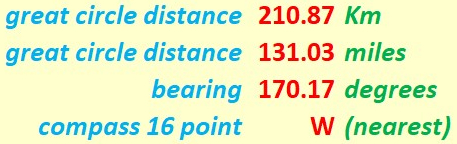
If you espouse the quantitative in life, here you duly see some numbers!
Our "straight line" distances are actually "great circle" distances on the earth's surface. Indeed, we can speak of the distances as the "hypothetical crow" (cornix hypothetica) flies.

Cornix Hypothetica, our hypothetical crow,
isn't any old bird, as we should know.
Cornix Hypothetica! Many miles for us you go,
with many a "straight line" o'er Earth to show.
Outline Map of Our "Circular" Walk from Wern-Watkin
The walk you see described here is circular based on Wern-Watkin. The walk is about 13½ miles long. The "orange arrow" in the map indicates the direction taken on the walk. As mentioned above, while I did not have precise records of this walk, there are a number of aspects which led me to resurrecting this track and obtaining its GPX file.
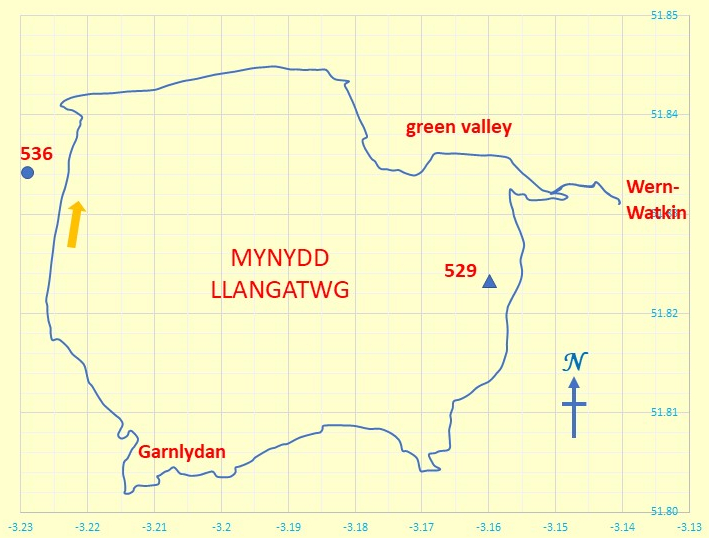
Outline Map of Our Walk
Y and X axes are in degrees latitude and longitude respectively.
The map grid scales translate to 1.112 Km per 0.01° latitude and a mean of 0.687 Km per 0.01° longitude, all when using 6371.0 Km as the volumetric mean radius of the earth - as per the WGS84 standard! In Scales, in the Lake District, the longitude scale is less (as expected), with a mean of 0.644 Km per 0.01° longitude; in fact, in doesn't take too much brain power to conclude that in Scales the distance is 43 metres per 0.01° longitude less than in Wern-Watkin!
Because we don't live on a flat earth - unless you are a convinced "flat-earther" - maps are inevitably a distortion of what is. In other words, it's all a matter of mapping a curvaceous surface onto a flat surface. We don't want to carry curvaceous representations of the terrain on our walks, do we? In our case, the northern length of our map grid is stretched out by an extra 0.11 %, to make it the same on the page as the length of the southern part of our map grid. Not that much for hiking purposes really! Can't complain.
Height Profile of Our Walk
Here we look at (1) the total ascent, (2) the definition of mean sea level and (3) the use, for the plot, of a "true origin".
- Total Ascent. It's of course fine to say that we reached about 521 metres above sea level, but what's the significance of that? Probably, of greater interest when it comes to considering personal achievements, is the total ascent, (which incidentally usually requires greater effort than the descent).
- Mean Sea Level. The heights are of course those above the mean sea level as defined by the OS® reference at Newlyn in Cornwall.
- True Origin. The plot uses a true origin to enable the significance of the heights to be readily appreciated. A false origin would have masked this!
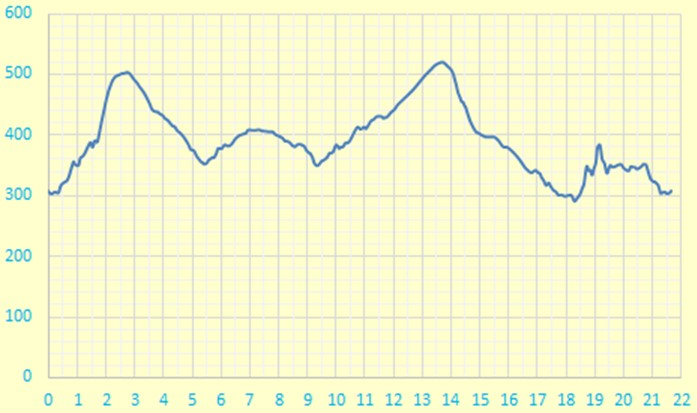
Height Profile
X and Y axes are in units of metres and kilometres respectively.
Some Facts and Figures
Here are some "vital statistics" in metric and imperial units. Of course, as mentioned above, the total ascent exceeds the difference between maximum and minimum elevations; I'd suspect things, if the reverse transpired! In addition, total ascent and descent should be equal to each other. The same goes for the start and end elevation pair.
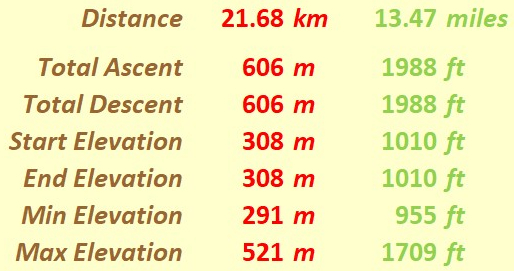
"Walk facts and figures"
Weather, Ground Conditions & Signposting
On any walk there are considerations which are very real but tantalizingly out of ready reach of those who wish to espouse a numerical approach to many of life's activities. Here are three considerations for starters.
- Weather: We stayed at Wern-Watkin for two full days, namely Saturday and Sunday. The weather for our circular Saturday walk was just right for walking - sunshine and some clouds. In this respect, we were lucky. However, Sunday and Monday, the day of our departure, were both very wet!
- Ground Conditions: It was not unduly muddy on our Saturday walk. This might have changed on Sunday and Monday!
- Signposting: I can't remember the quality of the signposting. However, as always, if you are new to these walks (1) a compass and an OS® map or (2) a smart phone with map and navigation facilities is mandatory!
Timing and Speed
It's one thing to discuss the terrain over which we walk. It's quite another to ask how we personally respond to walking over that terrain. There are a number of considerations, of which timing and speed can be taken as starting points.
Our walk was about 13½ miles long. We started at about 10:00 and finished about 17:00. It was May, so sufficient daylight was at our disposal. With 1¼ hours for stops, this gave about 5¾ hours walking time. The speed would thus have been about 2.35 mph. This is quite good considering that we were walking in hilly terrain and that generally the walking speed of a fit human ranges between 2 and 2½ mph!
Of course, some might say that a walk should really be more for enjoyment rather than for trying to reach a given physical fitness aim!
Track File
If you are keen to see our walk superimposed on an Ordnance Survey® (OS) map or on another system such as Google Maps®, then you can use this file to do so. The numerical data in this file were hand-plotted by me from memory (no GPS!) at home, using BikeHike.co.uk. The data are based on WGS84. Of course, for copyright reasons, I do not show the OS-based or Google-based maps here.
Here is the track of our circular Wern-Watkin walk as a GPX file.
And Finally - a Matter of Practicality
Any map is an approximate representation of what is. Practicality and scale are relevant considerations. We are not dealing with a planning application calling for detailed spatial descriptions of intricate boundaries. For us in the hiking community, the degrees of accuracy and precision should be just enough to give us useable and helpful knowledge of the terrain about us and beneath our feet. I hope my humble endeavours on this page are in this respect interesting for, and useful to, you my reader!
Appendix: Google® Map
Here you will see a Google® view at a height of 224 metres of the area around the Wern-Watkin Bunkhouse. In order to explore the wider area, you can of course alter the detail (+ -) and change from "Satellite" to "Map" settings.
Eric Scharf
Original Version: 2020-03-04 @13:11
Latest Update: 2020-03-04 @13:11
SAGAX REX HANC RETIS ORBIS PAGINAM PINXIT ANNO MMXX.
© Eric Scharf 2020