
|
Chingford to Epping MAPS HEIGHTS 18th March 2009 |

|
| Where ? Walks Map Heights Figures Weather Timing Tracks Finally Read Me |

Features of Our Walk from Chingford to Epping
Our walk is "linear" and takes in the countryside immediately to the north west of Epping Forest as well making "forays" into the Forest. We start in London and finish in Essex; most of our walk is in Essex. Despite this, both start and finish are in the TfL Zone 6, making it easy for those relying on public transport and coming from London or anywhere close to a railway station. The walk is about 12½ miles; with maximum and minimum elevations of 120 and 36 metres (394 and 118 feet). Who says that Essex is entirely flat! Indeed, these walks have some interesting undulations and associated viewpoints towards the south and the west.
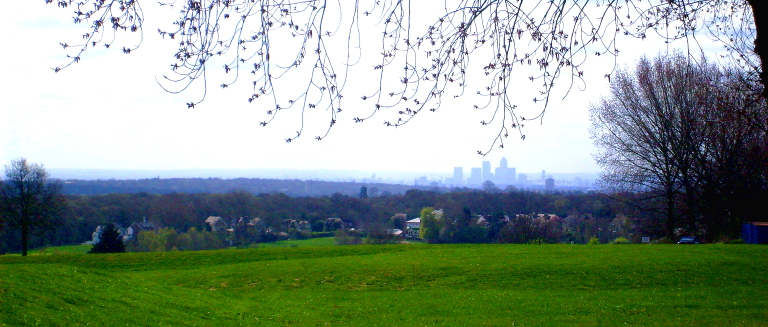
From Chingford we reach the London Loop from where
we can look south towards the City of London with its skyscrapers.
Now prepare ye for some plots and graphs. Not too overwhelming, but hopefully quite interesting! You will see here:
- Where are Chingford and Epping?
- An Outline Map of Our Walks
- Height Profiles of Our Walks
- Some Facts and Figures
- Weather, Ground Conditions & Signposting
- Timing & Speed
- Track Files
- And Finally
Where are Chingford and Epping?
We take the centre of London as the reference point. The centre of London is officially taken as the intersection of The Strand, Whitehall and Cockspur Street. This intersection is often referred to as Charing Cross, not to be confused with the nearby Victorian Eleanor Cross itself, nor the station in front of which the cross stands.
We then use the WGS84 system, which will give us longitude and latitude for our two points of interest. In our case these two points are the centre of London and either Chingford or Epping. The WGS84 system uses a reference ellipsoid for the earth. However, for ease of our own calculation for the distances on this web page, we can, without loss of any significant accuracy, assume that the earth is a sphere with a volumetric mean radius of 6371.0088 Km. This enables us to find conveniently the shortest distance - as the crow flies - between any two points of interest on the earth's surface. This distance is along the circumference of the "great circle". To find this distance, we use a bit of trig from our school days - a nice little dose of sines and cosines. Who says that trig is boring?
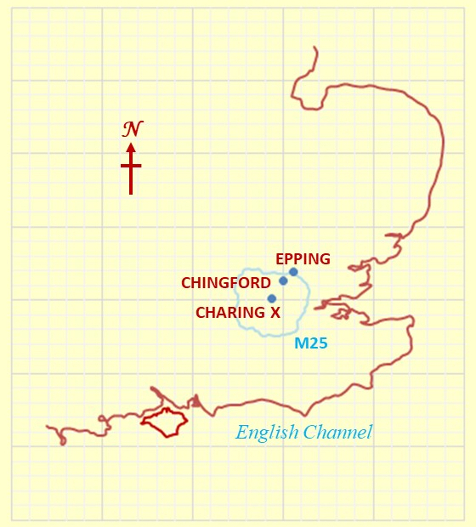
Here you see a "sketch" of South East England, showing the M25
and the locations of the Centre of London as well as of Chingford and Epping Stations.
Vertical Axis: Degrees Latitude: 50.0 to 53.5.
Horizontal Axis: Degrees Longitude: 3.0 west to 2.0 east.
To calculate the actual distances along the respective great circles, we have, as stated above, assumed the earth to be spherical. It makes our maths "reasonably" easy and gives us a maximum error of about 0.2% in our distance values. Not that much really! Can't complain!
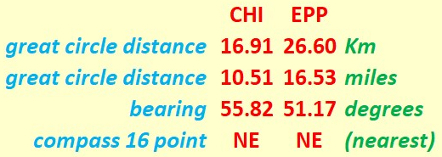
If you espouse the quantitative in life, here you duly see some numbers!
Chingford and Epping are about 11 and 17 miles respectively from the Centre of London.
So, our "straight line" distances are actually "great circle" distances on the earth's surface. Indeed, we can speak of the distances as the "hypothetical crow" (cornix hypothetica) flies.

Cornix Hypothetica, our hypothetical crow,
isn't any old bird, as we should know.
Cornix Hypothetica! Many miles for us you go,
with many a "straight line" o'er Earth to show.
If you would really like to know more about the 0.2% figure, you could repeat our great circle distance calculations three times, using equatorial, polar and mean earth radii as given in the last figure in the previous above reference on the WGS84 system. Choose a nice enjoyable rainy day for this exercise! To save you the effort (!!), here are the distance error values you would get using the equatorial or polar radius instead of the mean radius of the earth. This is so, since along a great circle on the surface of a sphere of radius r, the distance subtended by an angle θ (in radians) at the centre of the sphere is rxθ. This is always theoretically so, whatever the value, in radians, that the angle θ happens to have for our particular situation or application.
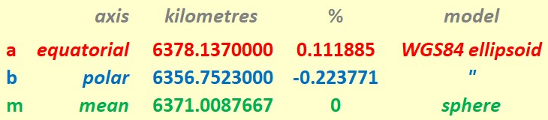
Great Circle distance maximum error values when using
the equatorial radius (a) or the polar radius (b)
compared with using the mean radius (m).
Any point in Great Britain will be at a latitude of between 50° to 52°. Hence the distance of this point to the centre of the earth will be close to the mean value "m" above. Distance errors on the earth's surface in Great Britain, when assuming a sphere as opposed to an ellipsoid, will therefore probably be well within the +0.1% to -0.2% range.
Outline Map of Our Walk from Chingford to Epping
Our walk is "linear" and takes in the countryside immediately to the north west of Epping Forest as well making "forays" into the Forest. We start in London and finish in Essex; most of our walk is in Essex. The "orange arrows" in the map indicate the direction of the walk.
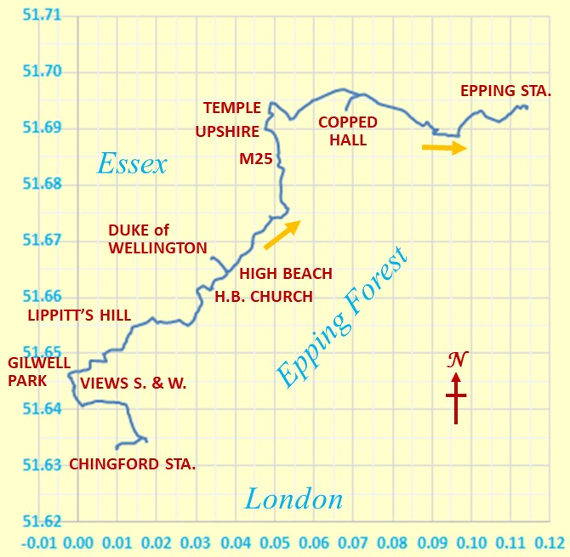
Outline Map of Our Walks
Y and X axes are in degrees latitude and longitude respectively.
The map grid scales translate to 1.112 Km per 0.01° latitude and a mean of 0.690 Km per 0.01° longitude, all when using 6371.0 Km as the volumetric mean radius of the earth - as per the WGS84 standard! In Scales, in the Lake District, the longitude scale is less (as expected), with a mean of 0.644 Km per 0.01° longitude; in fact, in doesn't take too much brain power to conclude that in Scales the distance is 26 metres per 0.01° longitude less than in Chingford!
Because we don't live on a flat earth - unless you are a convinced "flat-earther" - maps are inevitably a distortion of what is. In other words, it's all a matter of mapping a curvaceous surface onto a flat surface. We don't want to carry curvaceous representations of the terrain on our walks, do we? In our case, the northern length of our map grid is stretched out by an extra 0.20 %, to make it the same on the page as the length of the southern part of our map grid. Not that much for hiking or walking purposes really! Can't complain!
Height Profile of Our Walk
Here we look at the definition of mean sea level - our U.K. height reference. Of further relevance is the total ascent.
- Mean Sea Level. The heights are of course those above the mean sea level as defined by UK's OS® reference at Newlyn in Cornwall, otherwise known as "Ordnance Datum Newlyn". Other countries have different references, but I shan't go into the technical reasons here!
- Total Ascent. It's of course fine to say that we reached about 120 metres (394 feet) above sea level, but what's the significance of that? Probably of greater interest when it comes to considering personal achievements, is the total ascent (which, incidentally, usually requires greater effort than the descent). The actual values are given in the next section.
- False Origin? In order to give a realistic visual representation of the heights, the origin of the y-axis starts appropriately at a height of 0 metres and not at (e.g.) 30 metres.
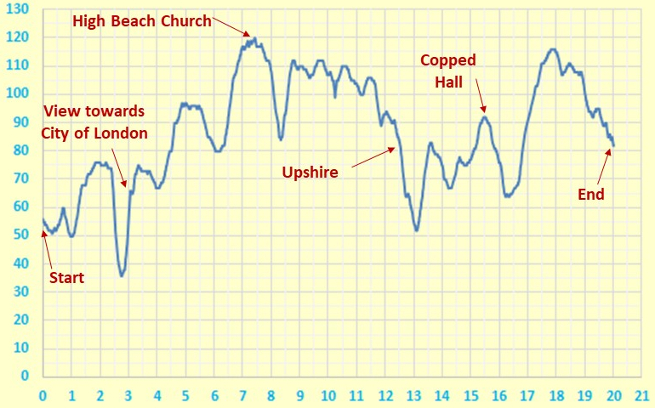
Height Profile
X and Y axes are in units of metres and kilometres respectively.
Some Facts and Figures
Here are some "vital statistics" in metric and imperial units. Of course, the total ascent invariably exceeds the difference between maximum and minimum elevations; I'd suspect things, if the reverse transpired!
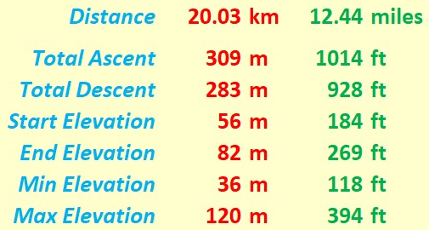
"Walk facts and figures"
I plotted our walk by hand on my return home. While of course I tried to be as accurate as possible, even OS® maps may not display all the possible paths. Added to this is the fact that occasionally we make - usually hopefully safe and legitimate - short cuts across open access terrain. However, the result shown on this page is for indicative purposes and does not aspire to the heights of scientific accuracy, however precise the result may be!
Weather, Ground Conditions & Signposting
On any walk there are considerations which are very real but tantalizingly out of ready reach of those who wish to espouse a numerical approach to many of life's activities. Here are three considerations for starters.
- Weather: The pictures suggest that it was a nice crisp March day - nice for walking. We are dealing with a walk that took place over 11 years ago, so it may be a challenge to dig out actual weather readings, which are probably hiding somewhere in the recesses of the web!
- Ground Conditions: If I remember (!!), some places still had some muddy left-overs from previous wet weather. Hence, walking boots were necessary.
- Signposting: Many paths were suitably signposted, but as always, especially if you are new to these walks, an OS® map of the area can be very helpful!
Timing and Speed
It's one thing to discuss the terrain over which we walk. It's quite another to ask how we personally respond to walking over that terrain. There are a number of considerations, of which timing and speed can be taken as starting points.
Taking the length of the walk as 12.5 miles and an average walking speed of 2.5 mph, we get a time of 5.0 hours. All doable on a walk in March, considering that pictures also had to be taken and snacks eaten!
Of course, if you set out to time your walk, you could see how fast you walked. However, I think that these walks should really be more for enjoyment than for trying to reach a given physical fitness aim.
Track Files
If you are keen to see our walk superimposed on an Ordnance Survey® (OS) map or on an OSM® map, then you can use the following file to do so. For copyright reasons, I do not display the OS or OSM map here. As mentioned, I plotted the walk by hand on my return home. While of course I tried to be accurate as possible with my plotting, even OS® maps may not display all the possible paths. In addition, there may be some additional walkabouts at places of sightseeing or gastronomical interest. However, the results as shown on this page and based on my hand plot, are for indicative purposes and do not aspire to the heights of scientific accuracy, however precise the results may be!
Here is the gpx track file.
And Finally - a Matter of Practicality
Any map is an approximate representation of what is. Practicality and scale are relevant considerations. We are not dealing with a planning application calling for detailed spatial descriptions of intricate boundaries. For us in the hiking and walking community, the degrees of accuracy and precision should be just enough to give us useable and helpful knowledge of the terrain about us and beneath our feet. I hope my humble endeavours on this page are in this respect interesting for, and useful to, you my reader!
Original Version: 2020-06-15 @11:54
Latest Revision: 2020-07-04 @08:28
SAGAX REX HANC RETIS ORBIS PAGINAM PINXIT ANNO MMXX
© Eric Scharf 2020