 |
WALK FEATURES Dean Forest 29th April to 2nd May 2016 |
|
| WHERE ? MAPS HEIGHTS FIGURES SLOPES TIMING TRACKS EXTRA THANKS READ ME |
Features of Our Walks
The Forest of Dean has many opportunities for interesting walks, even if these do not reach the heights and total ascents associated with other parts of the U.K.. Our Symond's Yat walk was about 17½ miles long, and we reached a maximum of about 238 m above sea level, near Berry Hill on the same walk. The five walks featured here have a combined length of about 73 Km or 45⅓ miles, and provide a total ascent approaching 1⅔ Km. Some quite respectable figures, indicating that we were quite fit! The Forest of Dean once provided a lot of the wood for building Britain's navy of old. However, the landscape is not entirely forest, as, for example, our Symond's Yat walk showed.
Symond's Yat was our destination on our 17½ mile circular walk
from Parkend on the last day of April.
Now prepare ye for some plots and graphs. Not too overwhelming, but hopefully quite interesting! You will see here:
- How far is Parkend from the Centre of London?
- Outline Maps of Our Walks
- Height Profiles of Our Walks
- Some Facts and Figures
- Average Rising and Falling Gradients
- Less Quantifiable Considerations
- Timing & Speed
- Track Files
- Postscript
- Thanks - Acknowledgements
- Please Read Me! Thankyou!
How far is Parkend from the Centre of London?
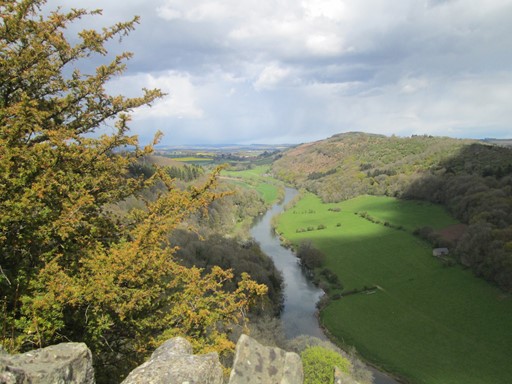
To start with, our starting point on most days, namely The Fountain Inn in Parkend, is about 170 Km, or 106 miles, west of the centre of London. These figures are based on a bit of Spherical Geometry, taking the centre of London as the intersection of The Strand, Whitehall and Cockspur Street. This intersection is often referred to as Charing Cross, not to be confused with the Victorian Eleanor Cross itself nor the station in front of which it stands. The detailed figures, for the fun of it, are as shown below.
The Fountain Inn in Parkend lies about 106 miles west of the centre of London.
Essentially we are looking at the distance on a great circle of the earth, assuming the earth to be spherical, which is not far off the mark. Assuming the earth to be a sphere gives us an error of about 0.1% in our distance value. Not that much really! Can't complain! Indeed, we can speak of the distance as the "hypothetical crow" (cornix hypothetica) flies.

Cornix Hypothetica, our hypothetical crow,
isn't any old bird, as we should know.
Cornix Hypothetica has miles to go,
wi' many a "straight line" on Earth to show.
Outline Maps of Our Walks
Our walks were mainly focussed on Parkend and were, indeed mainly circular. As you can see, apart from our Symond's Yat walk, most were quite modest in length. Circularity meant that on most days, we were able to start from, and finish on, "our doorstep" in Parkend. No need to rely on transport other than our own two feet. More relaxing that way!
Summary of All Our Walks
The map below combines both our Parkend-based walks and our Tintern excursion. The MINUS sign associated with each longitude value indicates "degrees WEST of Greenwich". Adrian, thanks for your GPS readings for our Symond's Yat walk on Sunday, 30th April. The other walk tracks were hand-plotted by me from memory on my return home.
Outline Map of All Our Walks.
The map grid scales translate to 1.112 Km per 0.01° latitude and a mean of 0.688 Km per 0.01° longitude (WGS standard), both when using 6371.0 Km as the volumetric mean radius of the earth. It is interesting to compare the present longitude distance-to-degree ratio with that for other walks. It you do this, you will see that the further north you go, the less Km per degree longitude you get. Once you get to the Lake District the reduction in this ratio compared to that for walks in the south-east is quite noticeable. In Scales, in the Lake District, we already have a slightly smaller value of 0.644 Km per 0.01° longitude - a difference of 44 metres per 0.01° longitude compared with The Forest of Dean.
Because we don't live on a flat earth - unless you are a convinced "flat-earther" - maps are inevitably a distortion of what is. In other words, it's all a matter of mapping a curvaceous surface onto a flat surface. We don't want to carry curvaceous representations of the terrain on our walks, do we? In our case, the northern length of our map grid is stretched out by something like an extra 0.40 %, to make it the same on the page as the length of the southern part of our map grid. Not that much for hiking purposes really! Can't complain.
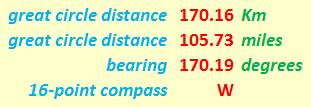
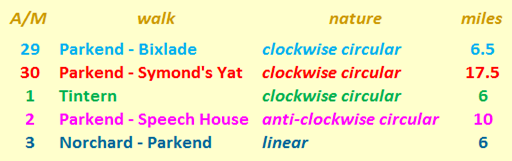
The next plot looks in more detail at our Parkend walks. The walks (each with the day of the month) included Bixlade (29), Symond's Yat (30), The Speech House (2) and Norchard (3).
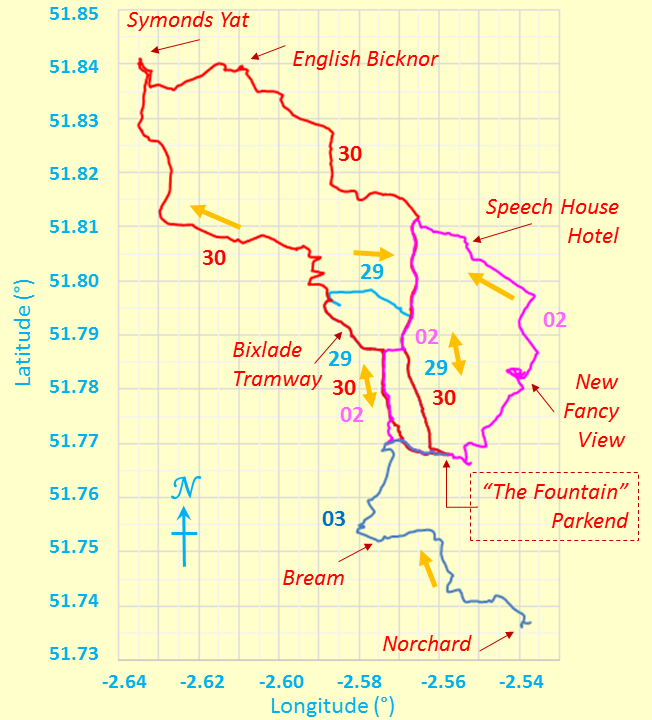
Outline Map of Walks based in Parkend
Next you see the clockwise Tintern walk (May 01) in greater detail. Most of the walk was in England, but it started in Tintern, in Wales, just across the border, formed here by the River Wye.
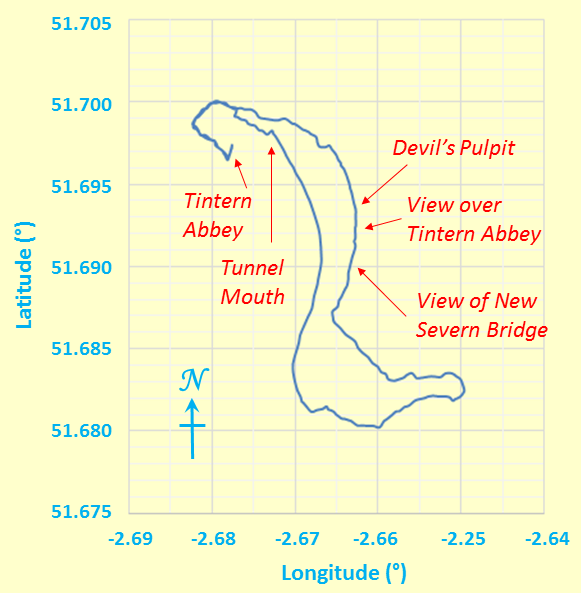
Outline Map of Our Tintern Walk
Height Profiles of Our Walks
We reached our highest points on our Symond's Yat walk on April 30, with 238 m at Berry Hill and 227 m just after re-entering the Forest beyond Eastbach Court. (Symond's Yat Rock and English Bicknor church weighed in at a mere 158 and 153 metres respectively.) Of course, in the Forest of Dean, the main focus is on the length of possible walks and the landscape through which they pass, as opposed to considerations of height.
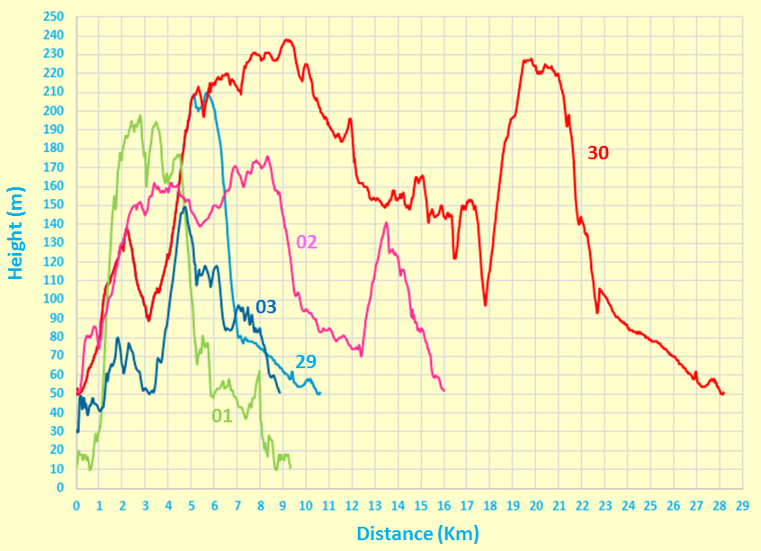
Height Profile
The above plot uses a true origin for the vertical elevation (height) axis, so as not to lose track of reality. What a worthy aim!
Some Facts and Figures
Here are some "vital statistics" in metric and imperial units. The total length of each walk is measured on the surface of the WSG84 spheroid. However, we can consider this, without undue loss of accuracy, as being on a conceptual "flat" plane at mean sea level, using the OS sea level reference as explained on OS "hiking" maps. There you are!
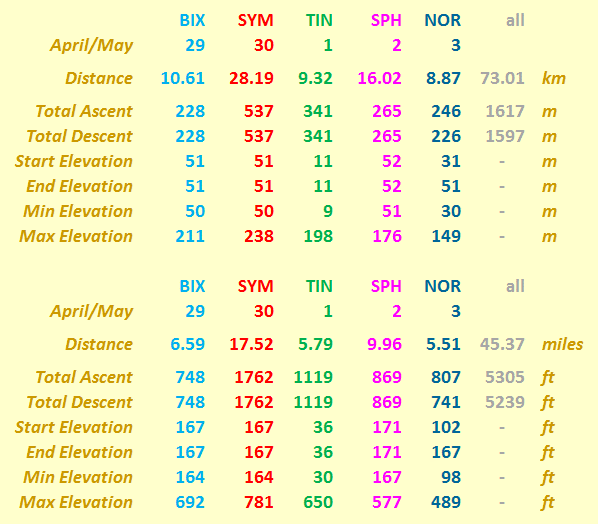
"Walk facts and figures"
It's of course fine to say that, for example, on our Symond's Yat walk we reached about 238 metres above sea level and descended to 50 metres above sea level (i.e. a height difference of 188 metres), but what's the significance of that? Probably, of greater interest when it comes to considering personal achievements, is the total ascent. On this particular walk, the total ascent was 537 m, which as expected, was greater than the difference of 188 metres between maximum and minimum heights above mean sea level. It's the total ascent which gets closer to being a measure of our fitness, rather than the maximum height reached.
Average Rising and Falling Gradients
And here, for the numerical fun of it, are the average gradients we overcame on our walks. The rising and falling (negative) gradients are both averaged over the distances given, with level stretches having rises and falls of less than ± ½ metre.
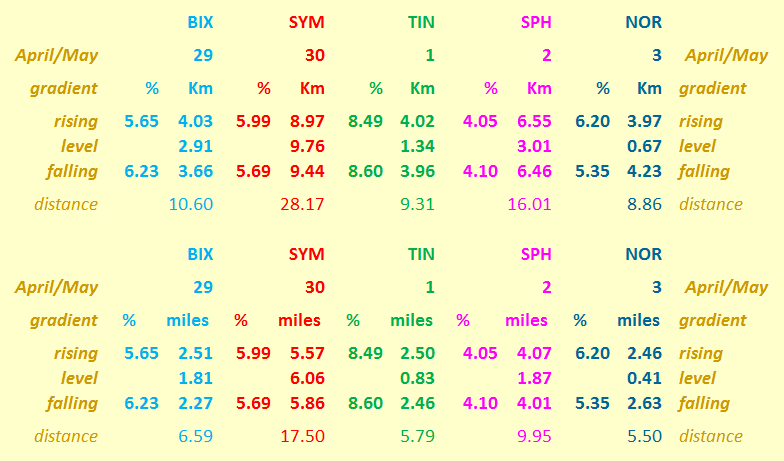
Rising and Falling Gradients
The average gradients and the distances over which they endure are, as expected, generally higher than those expected in day walks in the South-East. By comparison, Hertfordshire County Council recommends that its roads should not have longitudinal gradients of more than 5% and one of the steepest adhesion railways in the world, in Austria, has a maximum gradient of 11.6%.
By way of further interest, the clockwise route of the Fairfield Horseshoe in the Lake District has a total distance of 15.62 Km (9.71 miles), with the following calculations: an average rising gradient of 14.66% over 6.589 Km, a level part over 0.345 Km, and an average falling gradient of 11.11% over 8.676 Km. This is seen by many as really quite challenging - but then, when you compare it with our walks in the Forest of Dean, it can be said that we had more leisurely and less demanding aims compared with Lakeland challenges!
Less Quantifiable Considerations
On any walk there are considerations which are very real but tantalizingly out of ready reach of those who wish to espouse a numerical approach to many of life's activities. Here are three considerations for starters.
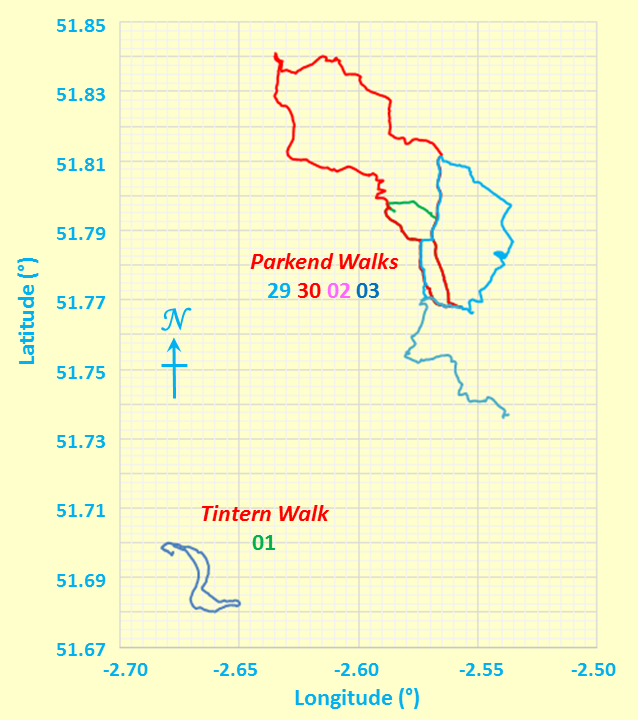
- Weather: As the pictures show, we had good walking weather with plently of sunshine on all days except for 3rd April which presented some sharp showers. No doubt, the enthusiastic could trawl web records of the prevailing temperature and humidity readings, but I'm sure we can continue here without them!
- Ground Conditions: It was not very muddy - certainly not enough not enough to impede our progress.
- Signposting: This was mainly of the nature "here's a footpath" or "here's a bridleway". However, we had OS maps to tell us where we were headed.
Timing and Speed
It's one thing to discuss the terrain over which we walk. It's quite another to ask how we personally respond to walking over that terrain. There are a number of considerations, of which timing and speed can be taken as starting points, should you wish to wax enthusiastic in these areas!
- Timing: I admit that I spent more time enjoying the walks rather than timing them precisely! However, we finished all walks quite comfortably within daylight hours!
- Speed: Our walking speeds were about 2 to 2½ mph.
Track Files
If you are keen to see our walks superimposed on an Ordnance Survey® (OS) map or on another system such as Google Maps®, then you can use the following five files for April 29, April 30, May 01, May 02 and May 03, respectively, to do so. The numerical data in four of these files were hand-plotted by me from memory (no GPS!) on my return home; however the file for April 30, is from Adrian's GPS, for which, Adrian, Many Thanks! The data are based on WGS84. Of course, for copyright reasons, I do not show the OS-based or Google-based maps here.
Postscript
Any map is an approximate representation of what is. Practicality and scale are relevant considerations. We are not dealing with a planning application calling for detailed spatial descriptions of intricate boundaries. For us in the hiking community, the degrees of accuracy and precision should be just enough to give us useable and helpful knowledge of the terrain about us and beneath our feet. I hope my humble endeavours on this page are in this respect interesting for, and useful to, you my reader!
Thanks - Acknowledgements
Adrian, thanks for your track file for Symond's Yat on April 30, a file which you so diligently recorded on your GPS! Together with the "Thanks" on the opening web page, I hope that I have not omitted any other individuals or any more items!
Eric Scharf
Original: 2016-08-26 @20:24
SAGAX REX HANC RETIS ORBIS PAGINAM PINXIT ANNO MMXVI.