 |
WALK FEATURES Folkestone to Dover Sunday 23rd July 2017 |
|
| WHERE ? MAP HEIGHTS FIGURES TIMING TRACK EXTRA FINAL READ ME |
Features of Our Walk
Our walk, ably led by Adrian, took us from 0 metres (mean sea level) up to 170 metres on the cliff tops along the "Heritage Coast" from Folkestone to Dover. The walk was very roughly west to east, and at just over nine miles (about 14⅔ Km), it was a comfortable Sunday walk. There were two steep ascents, which were actually "very doable" at a steady pace. Walking and weather conditions were good.
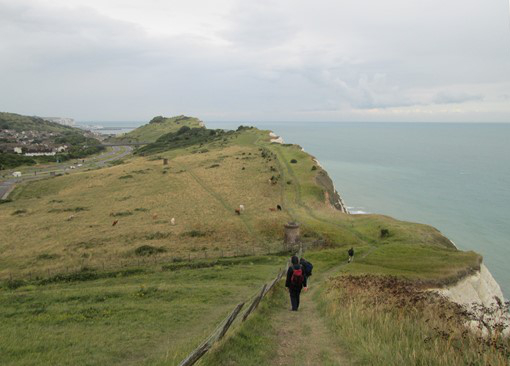
A large part of our walk was along the cliff tops above the Heritage Coast from Folkestone to Dover.
The French coast was about 26 miles away, and clearly visible across the English Channel.
Now prepare ye for some plots and graphs. Not too overwhelming, but hopefully quite interesting! You will see here:
- How far were we from the Centre of London?
- Outline Map of Our Walk
- Height Profile of Our Walk
- Some Facts and Figures
- Less Quantifiable Considerations
- Timing & Speed
- Track File
- Postscript
- Please Read Me! Thankyou!
How far were we from the Centre of London?
Our start and end points were Folkestone Central (FKC) and Dover Prior (DVP) stations respectively, which lie within a radius of 68 miles, very roughly east south east of the centre of London. The centre of London is officially taken as the intersection of The Strand, Whitehall and Cockspur Street. This intersection is often referred to as Charing Cross, not to be confused with the nearby Victorian Eleanor Cross itself, nor the station in front of which the cross stands. The detailed figures, for the fun of it, are as shown below.
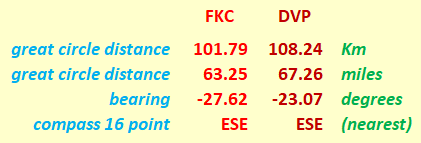
The start and end points of our walk were
both within a 68 mile radius, and both very roughly east south east, of the centre of London.
Our "straight line" distances are actually "great circle" distances on the earth's surface. We assume the earth to be spherical, which is not far off the mark. Assuming the earth to be a sphere gives us an error of about 0.1% in our distance values. Not that much really! Can't complain! Indeed, we can speak of the distances as the "hypothetical crow" (cornix hypothetica) flies.
Cornix Hypothetica, our hypothetical crow,
isn't any old bird, as we should know.
Cornix Hypothetica, many miles you'll fly,
drawing our "straight lines", in the sky.
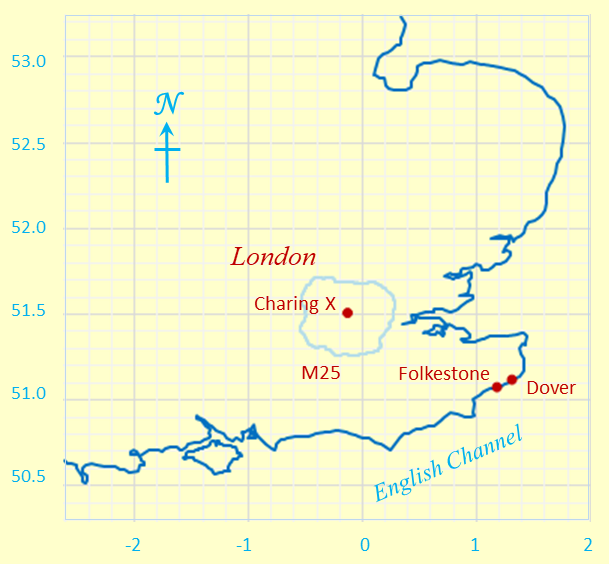
And here you can see the start and end points of our walk, namely
Folkestone Central (FKC) and Dover Priory (DVP) Stations, in the context of
(1) the South East of England, (2) the centre of London (Charing X) and (3) the M25.
Degrees Latitude and Longitude feature on the Y and X axes respectively.
Outline Map of Our Walk
Our walk was roughly west to east, from Folkestone to Dover, and largely along the cliff tops above the "Heritage Coast". At just over 9 miles (14⅔ Km) it was a relaxing Sunday walk with only two steep - but very doable - steep ascents. Being late July, we of course reached Dover comfortably before nightfall.
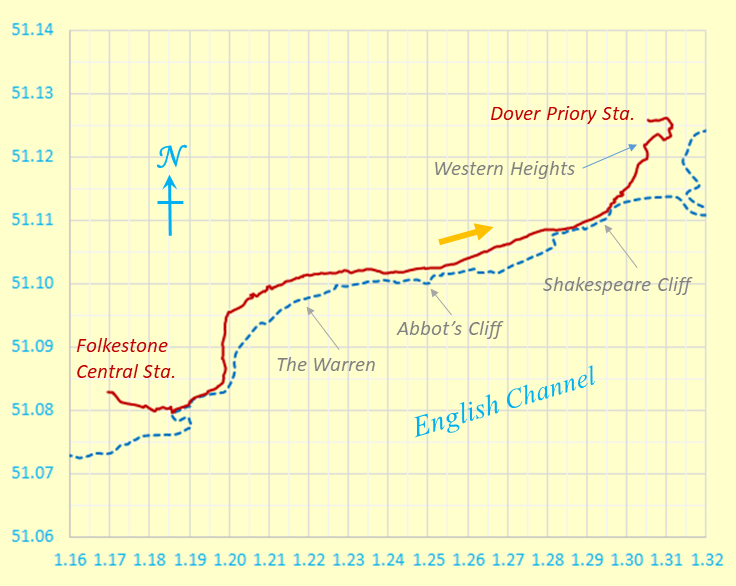
Outline Map of Our Walk.
Degrees Latitude and Longitude feature on the Y and X axes respectively.
Our walk is represented by the dark red line.
The dotted blue line represents the coast at mean sea level.
We were east of the Greenwich meridian. The map grid scales translate to about 1.112 Km per 0.01° latitude and a mean of 0.698 Km per 0.01° longitude (WGS standard), both when using 6371.0 Km as the volumetric mean radius of the earth. It is interesting to compare the present longitude distance-to-degree ratio with that for other walks. If you do this, you will see that the further north you go, the less Km per degree longitude you get. Once you get to the Lake District the reduction in this ratio compared to that for walks in the south-east is quite noticeable. In Scales, in the Lake District, we already have a slightly smaller value of 0.644 Km per 0.01° longitude - a difference of 54 metres per 0.01° longitude compared with our present Folkestone to Dover walk.
Because we don't live on a flat earth - unless you are a convinced "flat-earther" - maps are inevitably a distortion of what is. In other words, it's all a matter of mapping a curvaceous surface onto a flat surface. We don't want to carry curvaceous representations of the terrain on our walks, do we? In our case, the northern length of our map grid is stretched out by something like an extra 0.17 %, to make it the same on the page as the length of the southern part of our map grid. Not that much for hiking purposes really! Can't complain.
Height Profile of Our Walk
We reached our highest point (Maximum Elevation) at 170 m (558 feet) above mean sea level just after we had first scaled the cliff top above Folkestone's "The Warren", as per our "Facts and Figures" just below. This, of course, is compatible with our total ascent of 508 m (1667 feet). Indeed, it's the total ascent which gets closer to being a measure of our fitness, rather than the maximum height reached.
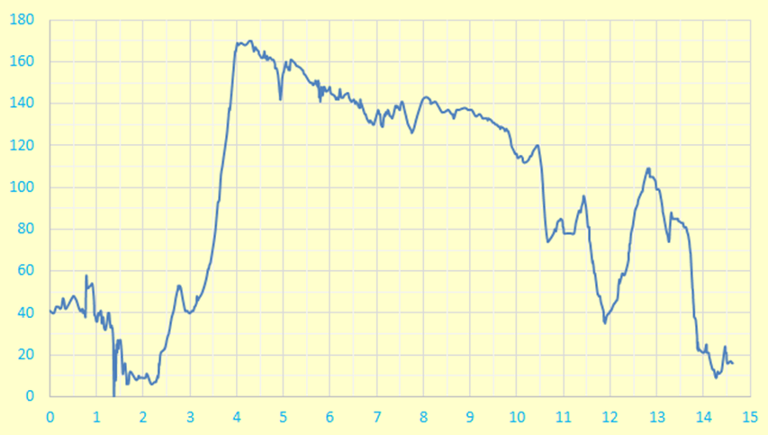
Height Profile
Units on the Y and X axes are metres and kilometres respectively.
Visual inspection of the height profile tells us that the steepest prolonged gradient on our walk occured between 3.529 and 3.978 Km into the walk, to reach the cliff top above the Warren. The height difference was (77 - 165) metres. This gives a gradient of 19.6% over a distance of 0.45 Km. By comparison, Hertfordshire County Council recommends that its roads should not have longitudinal gradients of more than 5% and one of the steepest adhesion railways in the world, in Austria, has a maximum gradient of 11.6%.
Some Facts and Figures
Here are some "vital statistics" in metric and imperial units. The total length our walk is measured on the surface of the WSG84 spheroid. However, we can consider this, without undue loss of accuracy, as being on a conceptual "flat" plane at mean sea level, using the OS sea level reference as explained on OS "hiking" maps. There you are!
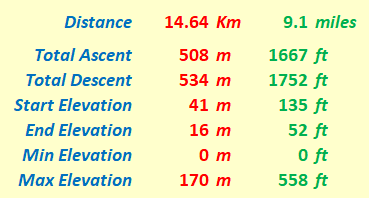
"Walk facts and figures"
Less Quantifiable Considerations
On any walk there are considerations which are very real but tantalizingly out of ready reach of those who wish to espouse a numerical approach to many of life's activities. Here are three considerations for starters.
- Weather: As the pictures show, we had good walking weather, cloudy yes, but mainly dry with only a "touch" of rain. From the "Accuweather" web site we glean that the weather for Folkestone was as shown below. These were the general conditions for the area; the (12 mm) precipitation did not worry us unduly!
- Ground Conditions: There were no muddy challenges.
- Signposting: Part of our walk coincided with the North Downs Way (yes "North" in the "South"!) as well as the Saxon Shore Way. These paths were quite well marked. Other markings were mainly of the nature "here's a footpath" or "here's a bridleway". However, we had OS® maps to tell us where we were headed.
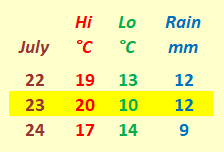
Weather conditions for Folkestone: 22-24 July 2017.
Timing and Speed
It's one thing to discuss the terrain over which we walk. It's quite another to ask how we personally respond to walking over that terrain. There are a number of considerations, of which timing and speed can be taken as starting points, should you wish to wax enthusiastic in these areas!
- Timing: Our walk started at about 11:54 and finished at about 17:34 with a total stop time for coffee in Folkestone and for lunch at the "Cliff Top Café" of about 1¼ hours.
- Speed: When taken with a total distance of 9.10 miles, the timing yielded a speed of about 2.06 mph. This is a comfortable walking speed, which, as I'm sure you'll agree, is quite acceptable for walkers of an IVC calibre.
Track File
If you are keen to see our walk superimposed on an Ordnance Survey® (OS) map or on another system such as Google Maps®, then you can use this file to do so. The data are based on WGS84. Of course, for copyright reasons, I do not show the OS-based or Google-based maps here.
Postscript
Any map is an approximate representation of what is. Practicality and scale are relevant considerations. We are not dealing with a planning application calling for detailed spatial descriptions of intricate boundaries. For us in the hiking community, the degrees of accuracy and precision should be just enough to give us useable and helpful knowledge of the terrain about us and beneath our feet. I hope my humble endeavours on this page are in this respect interesting for, and useful to, you my reader!
Original: 2017-07-28 @14:47; Last Updated: 2017-07-31 @09:55
SAGAX REX HANC RETIS ORBIS PAGINAM PINXIT ANNO MMXI ET MMXVII
© Eric Scharf 2017