 |
WALK FEATURES Gravesend to Sole Street Sunday 12th February 2017 |
|
| WHERE ? MAP HEIGHTS FIGURES SLOPES TIMING TRACK EXTRA FINAL READ ME |
Features of Our Walks
Our walk, ably led by Helen, took us from about 4 metres above sea level on the bank of the Thames into the North Downs countryside, to a maximum height of about 118 metres at Cobham Church. The walk was roughly north-south with a loop through Henley Street and Cobham before reaching Sole Street. At 10⅔ miles (17 Km) it was a comfortable Sunday walk. The rain kept off and it was not unduly muddy under foot.
Our walk took us through the gentle undulations of the North Downs. It was misty, but there was no rain and it was quite reasonable underfoot.
Now prepare ye for some plots and graphs. Not too overwhelming, but hopefully quite interesting! You will see here:
- How far were we from the Centre of London?
- Outline Map of Our Walk
- Height Profile of Our Walk
- Some Facts and Figures
- Average Rising and Falling Gradients
- Less Quantifiable Considerations
- Timing & Speed
- Track File
- Postscript
- Please Read Me! Thankyou!
How far were we from the Centre of London?
Our start and end points were Gravesend (GRV) and Sole Street (SOR) stations respectively, which lie about 22 and 24 miles, very roughly east south east of the centre of London. The centre of London is officially taken as the intersection of The Strand, Whitehall and Cockspur Street. This intersection is often referred to as Charing Cross, not to be confused with the nearby Victorian Eleanor Cross itself, nor the station in front of which the cross stands. The detailed figures, for the fun of it, are as shown below.
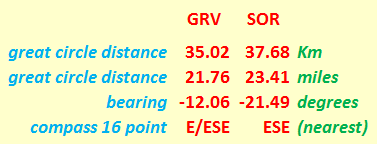
The start and end points of our walk were
both within a 24 mile radius, and both very roughly east south east, of the centre of London.
Our "straight line" distances are actually "great circle" distances on the earth's surface. We assume the earth to be spherical, which is not far off the mark. Assuming the earth to be a sphere gives us an error of about 0.1% in our distance values. Not that much really! Can't complain! Indeed, we can speak of the distances as the "hypothetical crow" (cornix hypothetica) flies.

Cornix Hypothetica, our hypothetical crow,
isn't any old bird, as we should know.
Cornix Hypothetica many miles for us can go,
with many a "straight line" o'er Earth to show.
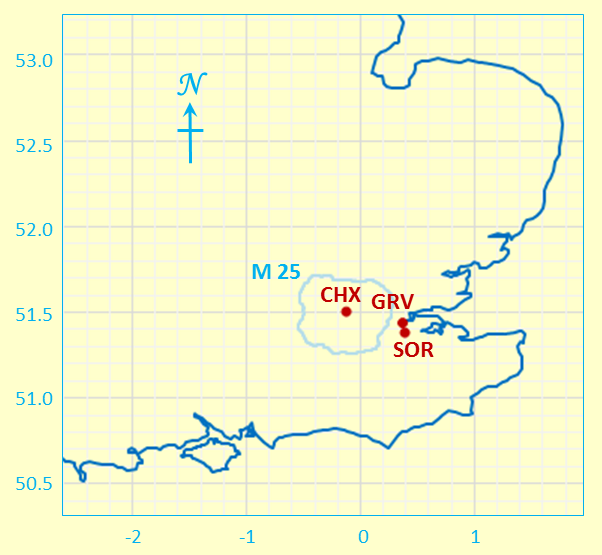
And here you can see the start and end points of our walk (Gravesend (GRV) and Sole Street (SOR) Stations in the context of:
(1) the South East of England, (2) the centre of London (Charing X / CHX) and (3) the M25.
Degrees Latitude and Longitude feature on the Y and X axes respectively.
Outline Map of Our Walk
Our walk was roughly north-south with a loop through Cobham before reaching Sole Street. At 10⅔ miles (17 Km) it was a relaxing Sunday walk with only a modest total ascent. Near the start, we benefitted by avoiding the busy A227 out of Gravesend, although this route was the official start of the Weald Way. Although it was still mid-February, we reached Sole Street comfortably before nightfall.
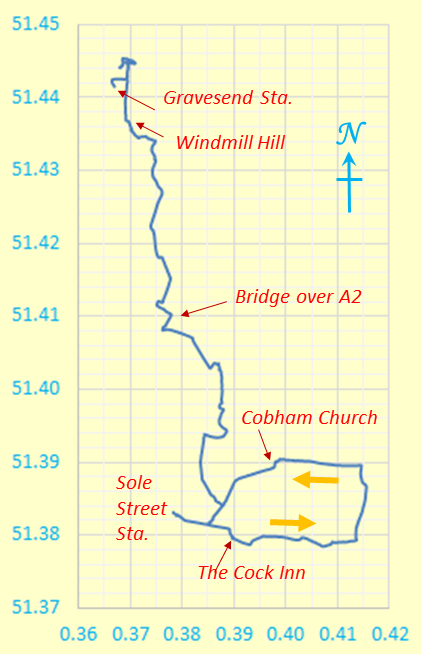
Outline Map of Our Walk.
Degrees Latitude and Longitude feature on the Y and X axes respectively.
We were east of the Greenwich meridian. The map grid scales translate to 1.112 Km per 0.01° latitude and a mean of 0.694 Km per 0.01° longitude (WGS standard), both when using 6371.0 Km as the volumetric mean radius of the earth. It is interesting to compare the present longitude distance-to-degree ratio with that for other walks. It you do this, you will see that the further north you go, the less Km per degree longitude you get. Once you get to the Lake District the reduction in this ratio compared to that for walks in the south-east is quite noticeable. In Scales, in the Lake District, we already have a slightly smaller value of 0.644 Km per 0.01° longitude - a difference of 50 metres per 0.01° longitude compared with our present Gravesend to Sole Street walk.
Because we don't live on a flat earth - unless you are a convinced "flat-earther" - maps are inevitably a distortion of what is. In other words, it's all a matter of mapping a curvaceous surface onto a flat surface. We don't want to carry curvaceous representations of the terrain on our walks, do we? In our case, the northern length of our map grid is stretched out by something like an extra 0.18 %, to make it the same on the page as the length of the southern part of our map grid. Not that much for hiking purposes really! Can't complain.
Height Profile of Our Walk
We reached our highest point at 118 m (387 feet) above mean sea level at Cobham Church - as per our "Facts and Figures" just below. This, of course, is compatible with our total ascent of 252 m (827 feet). Indeed, it's the total ascent which gets closer to being a measure of our fitness, rather than the maximum height reached.
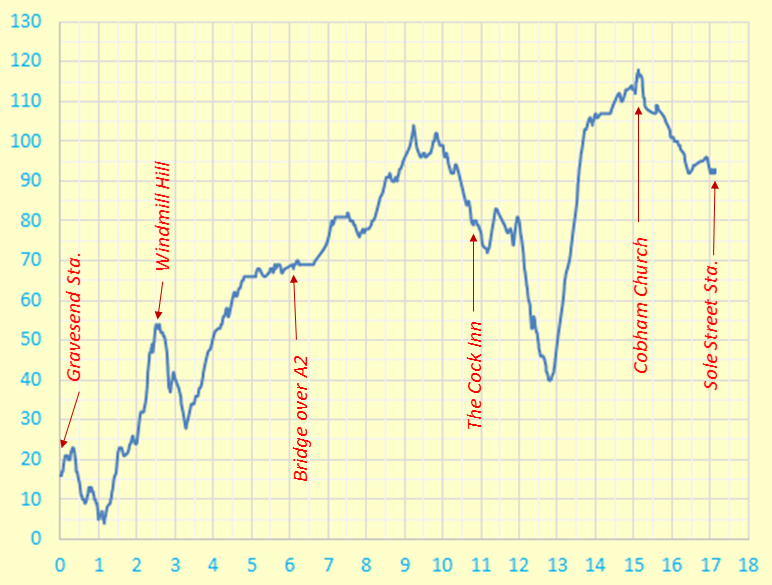
Height Profile
Some Facts and Figures
Here are some "vital statistics" in metric and imperial units. The total length our walk is measured on the surface of the WSG84 spheroid. However, we can consider this, without undue loss of accuracy, as being on a conceptual "flat" plane at mean sea level, using the OS sea level reference as explained on OS "hiking" maps. There you are!
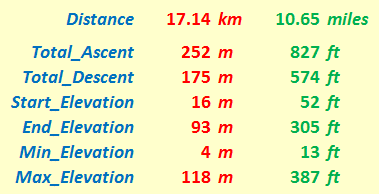
"Walk facts and figures"
Average Rising and Falling Gradients
And here, for the numerical fun of it, are the average gradients we overcame on our walks. The rising and falling (negative) gradients are both averaged over the distances given, with level stretches having rises and falls of less than ± ½ metre.
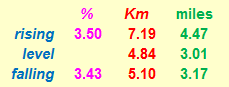
Rising and Falling Gradients
By comparison, Hertfordshire County Council recommends that its roads should not have longitudinal gradients of more than 5% and one of the steepest adhesion railways in the world, in Austria, has a maximum gradient of 11.6%.
By way of further interest, the clockwise route of the Fairfield Horseshoe in the Lake District has a total distance of 15.62 Km (9.71 miles), with the following calculations: an average rising gradient of 14.66% over 6.589 Km, a level part over 0.345 Km, and an average falling gradient of 11.11% over 8.676 Km. This is seen by many as really quite challenging - but then, when you compare it with our Borough Green walk, it can be said that we had more leisurely and less demanding aims compared with Lakeland challenges!
Less Quantifiable Considerations
On any walk there are considerations which are very real but tantalizingly out of ready reach of those who wish to espouse a numerical approach to many of life's activities. Here are three considerations for starters.
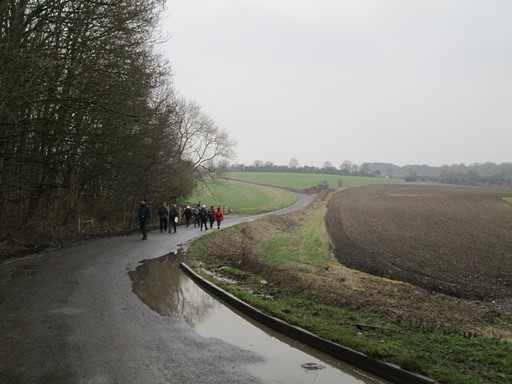
- Weather: As the pictures show, we had good walking weather, dry, albeit misty. From the "Accuweather" web site we glean that the weather for both Gravesend and Sole Street was as shown below. These were the general conditions for the area; the (3 mm) precipitation did not reach us!
- Ground Conditions: It was not unduly muddy.
- Signposting: This was mainly of the nature "here's a footpath" or "here's a bridleway". However, we had OS maps to tell us where we were headed.
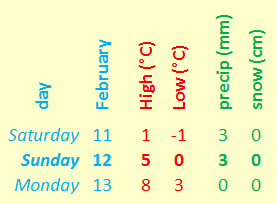
Weather conditions for Gravesend and Sole Street on Sunday 12th February 2017.
Timing and Speed
It's one thing to discuss the terrain over which we walk. It's quite another to ask how we personally respond to walking over that terrain. There are a number of considerations, of which timing and speed can be taken as starting points, should you wish to wax enthusiastic in these areas!
- Timing: Our walk started at about 10:06 and finished at about 16:25 with a total stop time for the pub in Henley Street and cultural visits in Cobham, of about 1¾ hours.
- Speed: With a total distance of 10.65 miles, this yielded about 2⅓ mph. This is a "normal sort of" walking speed, which, as I'm sure you'll agree, is quite acceptable for those of a CLOGgie calibre.
Track File
If you are keen to see our walks superimposed on an Ordnance Survey® (OS) map or on another system such as Google Maps®, then you can use this file to do so. The data are based on WGS84. Of course, for copyright reasons, I do not show the OS-based or Google-based maps here.
Postscript
Any map is an approximate representation of what is. Practicality and scale are relevant considerations. We are not dealing with a planning application calling for detailed spatial descriptions of intricate boundaries. For us in the hiking community, the degrees of accuracy and precision should be just enough to give us useable and helpful knowledge of the terrain about us and beneath our feet. I hope my humble endeavours on this page are in this respect interesting for, and useful to, you my reader!
Eric Scharf
Original: 2017-03-04 @11:35
SAGAX REX HANC RETIS ORBIS PAGINAM PINXIT ANNO MMXVII.