 |
WALK FEATURES Guildford Circular 6th July 2014 & 10th April 2016 |
|

Features of Our Circular Walk around Guildford
These two short walks of about 11 and 10 miles respectively in North Downs country were ably led by Paul. The heights stayed within a band of 31 to 166 metres (i.e. 135 metres), and with "ups" and "downs" and associated respective total ascents and descents of 299 and 230 metres, we had plenty of interest and good exercise. Walking weather was favourable, with temperatures of at least 10°C and plenty of sunshine to match. It was possible to complete the walks very comfortably within the available daylight hours.
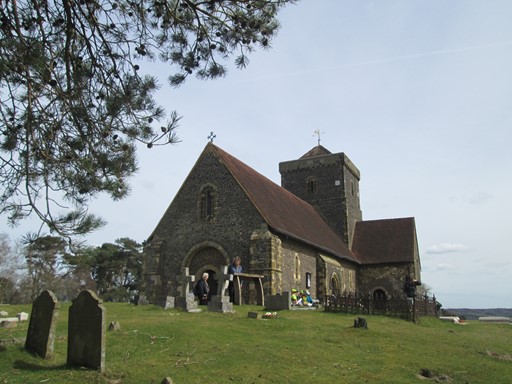
Saint Martha's Church has a commanding position in the Surrey landscape
and at about 166 metres (545 feet) is the highest point on our two walks.
Now prepare ye for some plots and graphs. Not too overwhelming, but hopefully quite interesting! You will see here:
- How far is Guildford from the Centre of London?
- An Outline Map of Our Walks
- Height Profiles of Our Walks
- Some Facts and Figures
- Average Rising and Falling Gradients
- Less Quantifiable Considerations
- Timing & Speed
- Track File
- Postscript
- Please Read Me! Thankyou!
How far is Guildford from the Centre of London?
To start with, our starting point, Guildford Station, is about 36 Km (or 22½ miles) south west of the centre of London. These figures are based on a bit of Spherical Geometry, taking the centre of London as the intersection of The Strand, Whitehall and Cockspur Street. This intersection is often referred to as Charing Cross, not to be confused with the Victorian Eleanor Cross itself nor the station in front of which it stands. The detailed figures, for the fun of it, are as shown below.
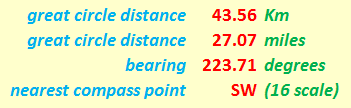
Guildford Station lies about 27 miles south-west of the centre of London.
Outline Map of Our Walks
Our walk was "clockwise circular", with the higher ground in the morning. The MINUS sign associated with each longitude value indicates "degrees WEST of Greenwich".
The map grid scales translate to 1.112 Km per 0.01° latitude and a mean of 0.697 Km per 0.01° longitude (WGS standard), both when using 6371.0 Km as the volumetric mean radius of the earth. It is interesting to compare the present longitude distance-to-degree ratio with that for other walks. It you do this, you will see that the further north you go, the less Km per degree longitude you get. Once you get to the Lake District the reduction in this ratio compared to that for walks in the south-east is quite noticeable.
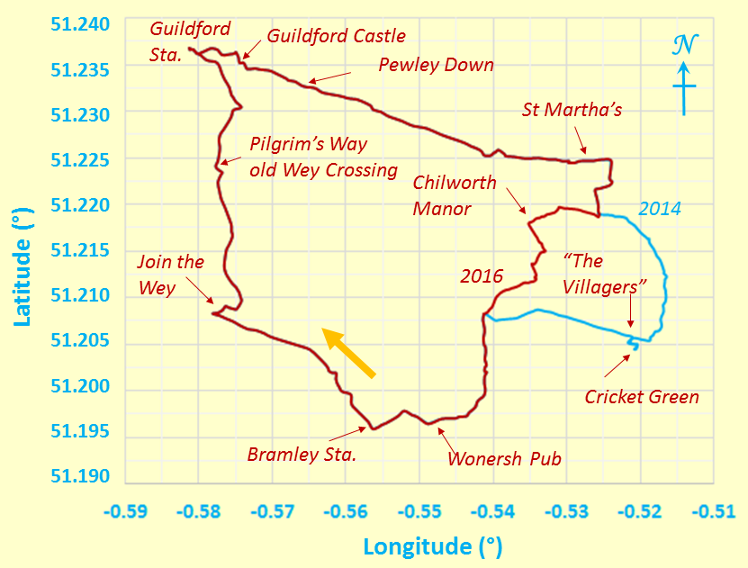
Outline Map of Walks
I plotted our walks by hand on my return home. Of course, I tried to be reasonably accurate. Even OS maps, on which I based my plots, may not show all the required detail, but appear to give the requisite degree of accuracy in this case.
Because we don't live on a flat earth - unless you are a convinced "flat-earther" - maps are inevitably a distortion of what is. In other words, it's all a matter of mapping a curvaceous surface onto a flat surface. We don't want to carry curvaceous representations of the terrain on our walks, do we? In our case, the northern length of our map grid is stretched out by something like an extra 0.11 %, to make it the same on the page as the length of the southern part of our map grid. Not that much for hiking purposes really! Can't complain.
Height Profiles of Our Walks
Our highest point was at Saint Martha's Church at about 166 metres above the mean sea level defined in OS maps. This was higher than the old semaphore station on Pewley Down, and higher than the "Villagers Pub" which we reached in 2014.
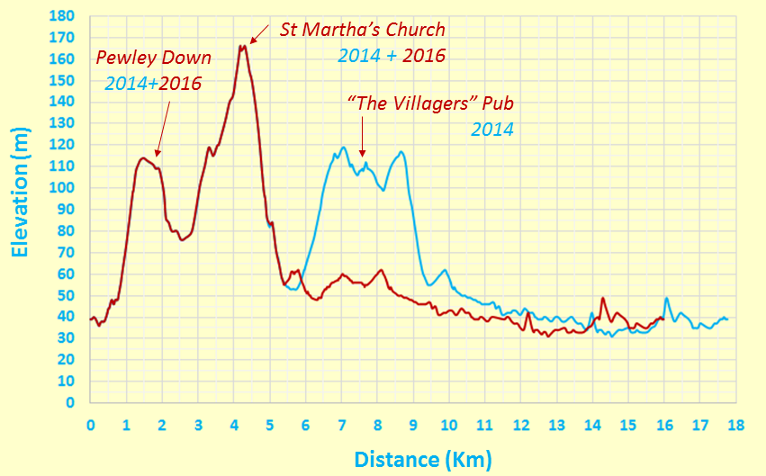
Height Profile
The above plot uses a true origin for the vertical elevation (height) axis, so as not to lose track of reality. What a worthy aim!
Some Facts and Figures
Here are some "vital statistics" in metric and imperial units. The total length of the walk is measured on the surface of the WSG84 spheroid. However, we can consider this, without undue loss of accuracy, as being on a conceptual "flat" plane at mean sea level, using the OS sea level reference as explained on OS "hiking" maps. There you are!
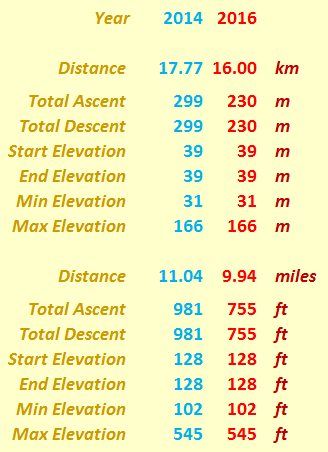
"Walk facts and figures"
It's of course fine to say that we reached about 166 metres above sea level and descended to 31 metres above sea level (i.e. a height difference of 135 metres), but what's the significance of that? Probably, of greater interest when it comes to considering personal achievements, is the total ascent - which usually requires greater effort than the descent. On these walks, the total ascents were 299 metres (981 feet) in 2014 and 230 metres (755 feet) in 2016, which as expected, were greater than the difference of 135 metres between maximum and minimum heights above mean sea level. The total ascents indicate that the 2016 walk was less sterenuous than its 2014 counterpart - which statement is duely is borne out by the height profiles above and the gradient values below.
Average Rising and Falling Gradients
And here, for the numerical fun of it, are the average gradients we overcame on our walks. The rising and falling (negative) gradients are both averaged over the distances given, with level stretches having rises and falls of less than ± ½ metre. The gradients are higher than the roughly 2.5% for many IVC Sunday walks, but of course, we were in North Downs country; in addition, our gradients were over quite modest distances. As can be seen, our 2014 walk was more strenuous than our 2016 walk in terms of mean gradients and the aggregate distances over which they endured.
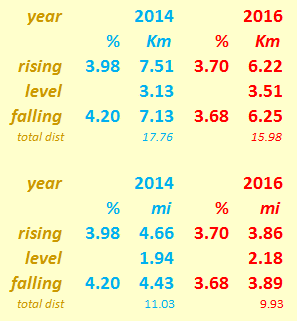
Rising and Falling Gradients
By comparison, Hertfordshire County Council recommends that its roads should not have longitudinal gradients of more than 5% and one of the steepest adhesion railways in the world, in Austria, has a maximum gradient of 11.6%. By way of further interest, the clockwise route of the Fairfield Horseshoe in the Lake District has a total distance of 15.62 Km (9.71 miles), with the following calculations: an average rising gradient of 14.66% over 6.589 Km, a level part over 0.345 Km, and an average falling gradient of 11.11% over 8.676 Km. This is seen by many as really quite challenging - but then, when you compare it with our walk, it can be said that we had a more leisurely and less demanding aim compared with Lakeland challenges!
Less Quantifiable Considerations
On any walk there are considerations which are very real but tantalizingly out of ready reach of those who wish to espouse a numerical approach to many of life's activities. Here are three considerations for starters.
- Weather: We had good walking weather. On our second walk, on 10th April 2016, the temperatures ranged betwen 10 and 12 deg C; according to the Met Office the readings at Farnborough had to represent Guildford as well. On our first walk, on 6th July 2014, as expected, it was warmer, but I do not have the actual figures to hand. On both walks it was dry and sunny with a little cloud.
- Ground Conditions: It was not very muddy - certainly not enough not enough to impede our progress.
- Signposting: This was mainly of the nature "here's a footpath" or "here's a bridleway". However, we had OS maps to tell us where we were headed.
Timing and Speed
It's one thing to discuss the terrain over which we walk. It's quite another to ask how we personally respond to walking over that terrain. There are a number of considerations, of which timing and speed can be taken as starting points. I don't have the timings to hand for our first walk, but the timings below for our second walk give an idea of our walking speed.
- Timing: Our second walk started, more-or-less according to plan, when the train arrived at Guildford Station. We set off at 10:40 and returned at about 16:35. This gave us 5:55 hours. Of course, we also had stops at St Martha's (snack break) and Wonersh (lunch break), and these stops probably totalled about 1:15 hours. Our walking time was thus about 4:40 hours.
- Speed: For our second walk, with a length of 9.94 miles and a walking time of 4:40 hours we get an average walking speed of 2.13 mph - in other words, just over 2 mph. This is less than your average walking speed of about 2½ mph, but we enjoyed ourselves and had good exercise, and that's of course important. So there you are!
Track Files
If you are keen to see our walks superimposed on an Ordnance Survey® (OS) map or on another system such as Google Maps®, then you can use the following files to do so. As mentioned above, the numerical data in these files, for 2014 and 2016 respectively, have been hand-plotted by me from memory (no GPS!) on my return home. The data are based on WGS84. Of course, for copyright reasons, I do not show the OS-based or Google-based maps here.
Postscript
Any map is an approximate representation of what is, and my plotting thereon certainly is. Practicality and scale are relevant considerations. We are not dealing with a planning application calling for detailed spatial descriptions of intricate boundaries. For us in the hiking community, the degrees of accuracy and precision should be just enough to give us useable and helpful knowledge of the terrain about us and beneath our feet. I hope my humble endeavours on this page are in this respect interesting for, and useful to, you my reader!
Eric Scharf
Original: 2016-04-24 @13:40
SAGAX REX HANC RETIS ORBIS PAGINAM PINXIT ANNO MMXVI.