 |
Hartington MAPS & HEIGHTS 18-23 April 2019 |
|
| Where ? Walks Map Heights Figures Weather Timing Tracks Finally Read Me |
Features of Our Walks from Hartington
The River Dove was the focus of our walks, all of which ended on our doorstep in Hartington, and two of which started from the same location. We complemented the natural verdant "cosiness" of Dovedale to the south with the wide open yet very scenic countryside to the north. Our walks into Dovedale took in Milldale, the picturesque village of Alstonefield and the famous "Stepping Stones" near Illam. Our walk towards the north took in Pilsbury Castle and the village of Sheen. The average on each of three days was about 9 miles (15 Km) with a total ascent of about ½ kilometre. So, it was a leisurely break for the walkers among us.
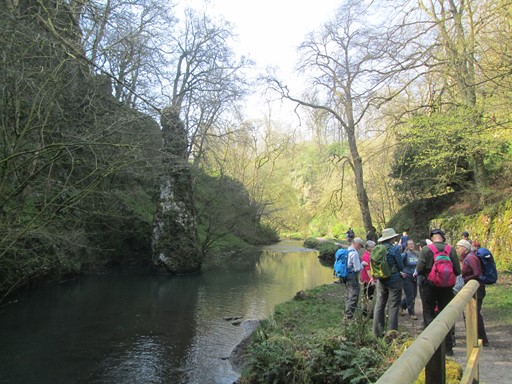
The River Dove flows through Beresford Dale which is an extension of Dovedale.
Here we stop for a picturesque break on the first walk of our Easter Trip.
For our stay we had dry sunny weather. It was not too hot - in fact, just right for walking. It felt refreshingly cool in some sheltered sections of Dovedale and its associated river valleys.
Now prepare ye for some plots and graphs. Not too overwhelming, but hopefully quite interesting! You will see here:
- Where is Hartington?
- An Outline Map of Our Walks
- Height Profiles of Our Walks
- Some Facts and Figures
- Weather, Ground Conditions & Signposting
- Timing & Speed
- Track Files
- And Finally
Where is Hartington?
Hartington lies roughly west of Matlock and south west of Buxton. It is on the B5054 in Derbyshire, but close to the Staffordshire border. Hartington still retains its charm from the days when it was a "village out in the wilds" of Derbyshire. However, private car is the easy way to reach it, since buses from Buxton are not that many, and certainly not on Sundays or Bank Holidays.
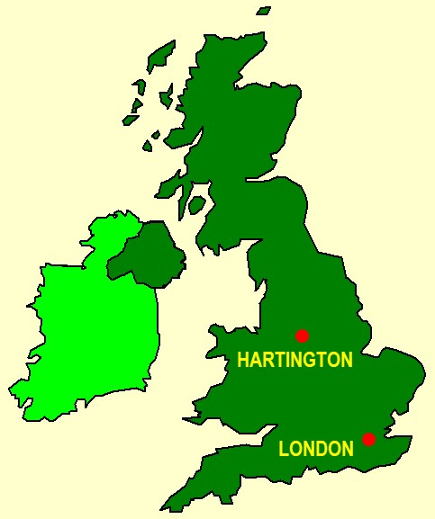
Here you see a "sketch" of the U.K. showing the approximate locations of Hartington and London.
This "map" is from the Microsoft® PowerPoint® Clip Art Library originally supplied with versions of MS_Office®.
If you espouse the quantitative in life, we have some numbers for you! What are these "great circle distances"? If you haven't met these before, I try, in my humble way, to give a little bit of an explanation below. However, this is probably not the place to wax unduly on the subject!
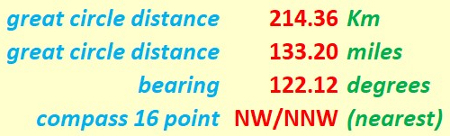
If you espouse the quantitative in life, here you duly see some numbers!
We start with the GPS coordinates of "The Centre of London" which is officially taken as the intersection of The Strand, Whitehall and Cockspur Street. This intersection is often referred to as Charing Cross, not to be confused with the nearby Victorian Eleanor Cross itself, nor the station in front of which the cross stands.
We look at the GPS coordinates of Hartington and work out the distance between Hartington and the "The Centre of London".
Our "straight line" distance is actually "great circle" distance on the earth's surface. We assume the earth to be spherical, which is not far off the mark. Assuming the earth to be a sphere gives us a maximum error of about 0.1% in our distance values. Not that much really! Can't complain! Indeed, we can speak of the distances as the "hypothetical crow" (cornix hypothetica) flies.
Cornix Hypothetica, our hypothetical crow,
isn't any old bird, as we should know.
Cornix Hypothetica! Many miles for us you go,
with many a "straight line" o'er Earth to show.
Outline Map of Three of Our Walks based on Hartington
There were three main walks (two circular) based on Hartington. I led these three walks, but other colleagues subsequently did - or repeated - some of these walks with minor alterations. Numbers, in "bus route" fashion, refer of course to the day of the actual walk. The walks I describe are those which I led on April 19, 20 and 22. Colours of numbers and routes are, for clarity, made to agree across the relevant sections on this web page, including (e.g.). in the height plots in the next section below. The appropriately coloured arrows indicate the direction of a walk. Where the paths on successive days overlap, the colour of the latest walk takes priority - because of the way my spreadsheet works!
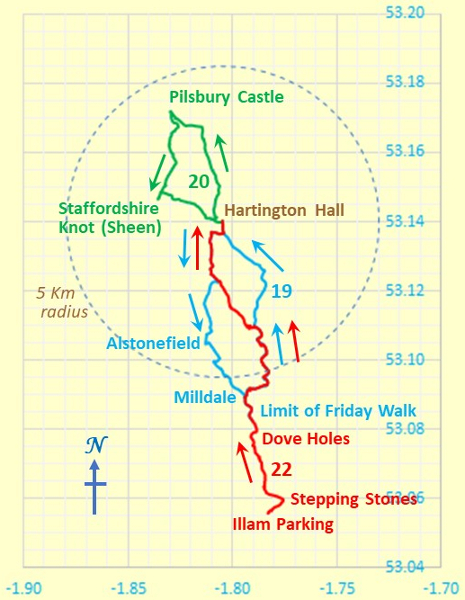
Outline Map of Our Walks
Y and X axes are in degrees latitude and longitude respectively.
Negative values indicate degrees longitude WEST of Greenwich
The map grid scales translate to 1.112 Km per 0.01° latitude and a mean of 0.670 Km per 0.01° longitude, all when using 6371.0 Km as the volumetric mean radius of the earth - as per the WGS84 standard! In Scales, in the Lake District, the longitude scale is less (as expected), with a mean of 0.644 Km per 0.01° longitude; in fact, in doesn't take too much brain power to conclude that in Scales the distance is 26 metres per 0.01° longitude less than in Llangollen!
Because we don't live on a flat earth - unless you are a convinced "flat-earther" - maps are inevitably a distortion of what is. In other words, it's all a matter of mapping a curvaceous surface onto a flat surface. We don't want to carry curvaceous representations of the terrain on our walks, do we? In our case, the northern length of our map grid is stretched out by an extra 0.16 %, to make it the same on the page as the length of the southern part of our map grid. Not that much for hiking purposes really! Can't complain.
Height Profiles of Our Walks
It's of course fine to say that we reached about 333 metres above sea level, but what's the significance of that? Probably, of greater interest, when it comes to considering personal achievements, is the total ascent (which usually requires greater effort than the descent). On the three walks shown here, the total ascent varied from one walk to the next in a range of about ½ kilometre. The starting and end elevations were 269 metres on all three days except for the start elevation of 144 metres on Easter Monday (April 22). The total ascent - as expected (!!) - was greater than the difference between maximum and minimum heights above the mean sea level as defined by the OS® reference at Newlyn in Cornwall.
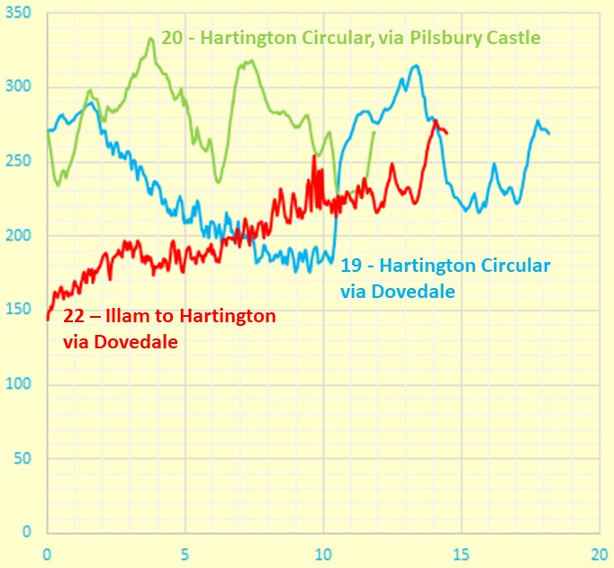
Height Profile
X and Y axes are in units of metres and kilometres respectively.
The above plot uses a true origin for the vertical elevation (height) axis, so as not to lose track of reality. What a worthy aim!
Some Facts and Figures
Here are some "vital statistics" in metric and imperial units. The total length of the walk is measured on a conceptual "flat" plane at mean sea level, WGS84 style. Of course, as mentioned above, the total ascent exceeds the difference between maximum and minimum elevations; I'd suspect things, if the reverse transpired!
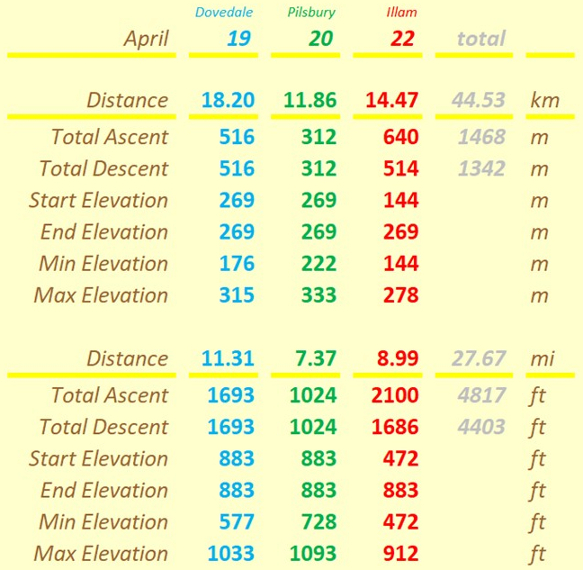
"Walk facts and figures"
Each route was derived using my GPS (Garmin®). Hence, the distances for each walk will include some walking about at places of interest; therefore, for each walk, these distances may be about ¼ Km above "true". However, all the results shown on this page are for indicative purposes and do not aspire to the heights of scientific accuracy, however precise the results may be!
Weather, Ground Conditions & Signposting
On any walk there are considerations which are very real but tantalizingly out of ready reach of those who wish to espouse a numerical approach to many of life's activities. Here are three considerations for starters.
- Weather: It stayed sunny and dry (i.e. zero precipitation) almost cloudless on all three days, Saturday, Sunday and Monday. The temperatures stayed in the low twenties and were thus ideal for walking. The table below
is derived from the "Accuweather" web site.
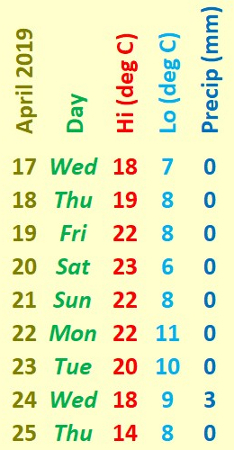
"Weather"
- Ground Conditions: There was hardly any mud!
- Signposting: The walking routes were - in the main - well marked. Congratulations to those caring for the local network of footpaths!
Timing and Speed
It's one thing to discuss the terrain over which we walk. It's quite another to ask how we personally respond to walking over that terrain. There are a number of considerations, of which timing and speed can be taken as starting points. If you wanted to, you could, for each walk, ascertain start and end times and times spent not walking (e.g. for lunch). Knowing the total distance covered in the walk and time spent actually walking, you obviously can determine the speed, which typically is about 2½ mph for a walk on flat terrain, reducing to (e.g.) 1½ mph on a more challenging terrain. I probably would not find too many takers for this information were I to calculate it accurately and precisely for each of the four walks described here!
Track Files
If you are keen to see our walk superimposed on an Ordnance Survey® (OS) map, then you can use the following files to do so. The data in these files were recorded by my GPS (Garmin®). The data are based on WGS84. Of course, for copyright reasons, I do not show the OS-based maps here. Furthermore, the plot may also include some walkabouts in hostelries and sightseeing places; hence there may be a slight over estimation of the length of a walk by perhaps ¼ Km. Don't worry that these files have "no style" or, put another way, that they "lack style information"!
Here are my Hartington walks for April 2019: 19, 20 and 22.
And Finally - a Matter of Practicality
Any map is an approximate representation of what is. Practicality and scale are relevant considerations. We are not dealing with a planning application calling for detailed spatial descriptions of intricate boundaries. For us in the hiking community, the degrees of accuracy and precision should be just enough to give us useable and helpful knowledge of the terrain about us and beneath our feet. I hope my humble endeavours on this page are in this respect interesting for, and useful to, you my reader!
Eric Scharf
Version: 2019-05-30 @13:49
SAGAX REX HANC RETIS ORBIS PAGINAM PINXIT ANNO MMXIX.
© Eric Scharf 2019