 |
CLOG - Second Highland Fling WALK FEATURES 24 - 28 May 2011 |
|
| WHERE ? WALKS MAP HEIGHTS FIGURES TIMING TRACKS EXTRA FINAL READ ME |
Features of Our Walks
Our walks covered a height range which is the largest in the British Isles, from almost sea level up to the highest point on land, namely Ben Nevis. In addition, we enjoyed a variety of landscapes and weather. Indeed, a memorable holiday of extremes - but most enjoyable. Jim Marlowe not only organized our away break, but capably led our four main walks on each successive day from May 25 to 28.

Here we are at the top of the British Isles, on Ben Nevis no less. We are at the highest (trig) point on the summit, sporting a bit of the Ranulph Fiennes look! Weather: interesting for the end of May!
Now prepare ye for some plots and graphs. Not too overwhelming, but hopefully quite interesting! You will see here:
- How far were we from the Centre of London?
- Overview of Our Walks
- Outline Map of Our Walks
- Height Profile of Our Walks
- Some Facts and Figures
- Less Quantifiable Considerations
- Timing & Speed
- Track Files
- Postscript
- Please Read Me! Thankyou!
How far were we from the Centre of London?
Our reference point is - for ease of location - Fort William Station (FTW), which was within about ½ mile from our residence. Fort William Station is over 400 miles from the centre of London. Note that the rail journeys from London to Edinburgh and Glasgow are already about 400 miles, but these journeys include numerous "twists and turns". The centre of London is officially taken as the intersection of The Strand, Whitehall and Cockspur Street. This intersection is often referred to as Charing Cross, not to be confused with the nearby Victorian Eleanor Cross itself, nor the station in front of which the cross stands. The detailed figures, for the fun of it, are as shown below.
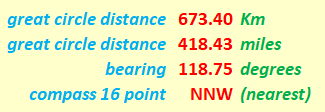
Fort William is about 420 miles NNW of the centre of London.
Our "straight line" distances are actually "great circle" distances on the earth's surface. We assume the earth to be spherical, which is not far off the mark. Assuming the earth to be a sphere gives us an error of about 0.1% in our distance values. Not that much really! Can't complain! Indeed, we can speak of the distances as the "hypothetical crow" (cornix hypothetica) flies.
Cornix Hypothetica, our hypothetical crow,
isn't any old bird, as we should know.
Cornix Hypothetica, many miles you'll fly,
drawing our "straight lines", across the sky.
Our Walks
We did four walks on four successive days. The next table shows these together with the respective lengths (in miles and Km) and total ascents (in metres). The total ascent is one measure of our fitness. A walk may be regarded as short, but may involve a significant total ascent. Thus, our ascent of Ben Nevis on May 27 is shorter than our walk along Glen Nevis on May 25, but, understandably, involves a much greater climb. For ease of identification the same colour scheme will apply to the subsequent sections: "map", "heights" and "facts and figures".
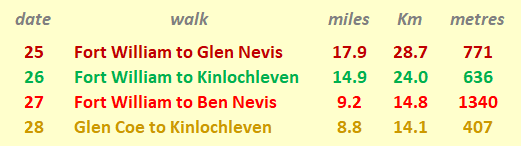
Summary of Our Walks
Outline Map of Our Walks
Our walks were essentially linear, although our walks up Ben Nevis (May 27) and along Glen Nevis (May 25) were "there and back", so could be regarded as a limiting case of circularity, if you wish to stick strictly to the letter!! As mentioned, our walks on May 25 along Glen Nevis and on May 26 to Kinlochleven started from the "Calluna" hostel, but for generality, I have assumed these to start from Fort William Station, which is less than ½ mile north east of the "Calluna".
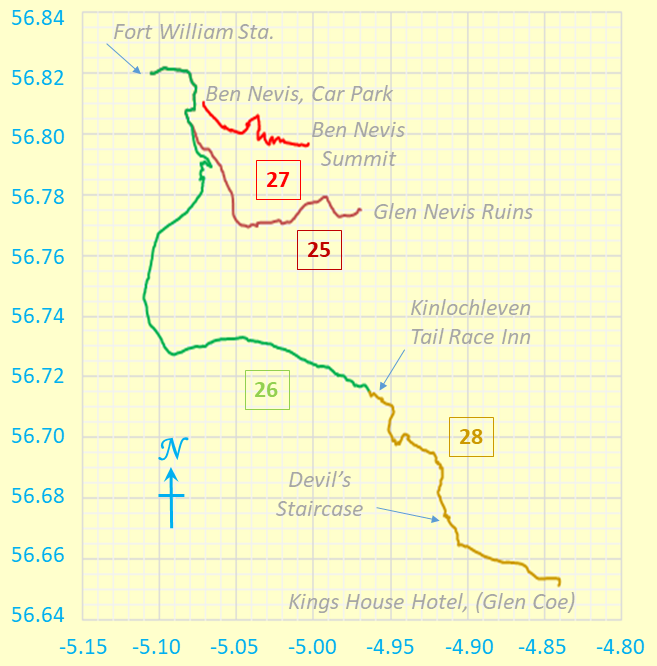
Outline Map of Our Walk.
Degrees Latitude and Longitude feature on the Y and X axes respectively.
For simplicity, the colours are replicated in the "heights" and "facts and figures" sections below.
The numbers, of course, relate to the dates of each walk.
We were west of the Greenwich meridian, hence the negative longitude values. The map grid scales translate to about 1.112 Km per 0.01° latitude and a mean of 0.60984 Km per 0.01° longitude (WGS standard), both when using 6371.0 Km as the volumetric mean radius of the earth. It is interesting to compare the present longitude distance-to-degree ratio with that for other walks. For example, for our Gravesend to Sole Street walk, the map grid scales are, as expected, the same for longitude but we have an appreciably higher mean of 0.69357 Km per 0.01° longitude. To emphasize, down south we had 83.73 metres more per 0.01° longitude.
Because we don't live on a flat earth - unless you are a convinced "flat-earther" - maps are inevitably a distortion of what is. In other words, it's all a matter of mapping a curvaceous surface onto a flat surface. We don't want to carry curvaceous representations of the terrain on our walks, do we? In our case, the northern length of our map grid is stretched out by something like an extra 0.53 %, to make it the same on the page as the length of the southern part of our map grid. Not that much for hiking purposes really! Can't complain.
Height Profiles of Our Walks
This was a holiday of extremes. Our walks took us the roof of the British Isles and more or less down to sea level. This implied that the scenery - as you can imagine and as the pictures show - was indeed magnificent! However, the walks were well within the physical capabilities of most CLOGgies! More details are revealed in the "Facts and Figures" table in the next section. Of course, it's our total ascent, and not the maximum height we reached, which is really an indication of our fitness.
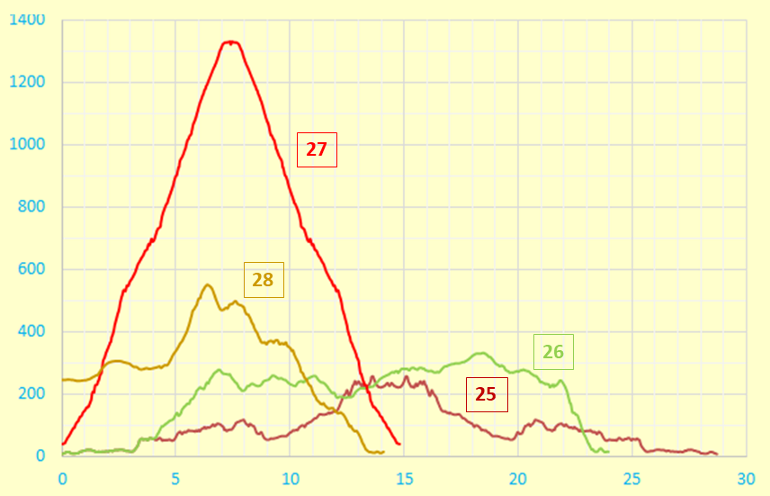
Height Profile
Units on the Y and X axes are metres and kilometres respectively.
Some Facts and Figures
Here are some "vital statistics" in metric and imperial units. The total length our walk is measured on the surface of the WSG84 spheroid. However, we can consider this, without undue loss of accuracy, as being on a conceptual "flat" plane at mean sea level, using the OS sea level reference as explained on OS "hiking" maps. There you are!

"Walk facts and figures"
Less Quantifiable Considerations
On any walk there are considerations which are very real but tantalizingly out of ready reach of those who wish to espouse a numerical approach to many of life's activities. Here are three considerations for starters.
- Weather: As the pictures of our four main walks show, it was quite cloudy with snow on the ground on the summit of Ben Nevis. However, it kept dry. Temperatures were good for walking, even on the summit of Ben Nevis.
- Ground Conditions: There were no really muddy challenges, but, as mentioned above, there was snow on the ground on the summit of Ben Nevis.
- Signposting: The paths were hardly signposted. However, many of us had OS® maps to tell us where we were headed.
Timing and Speed
It's one thing to discuss the terrain over which we walk. It's quite another to ask how we personally respond to walking over that terrain. There are a number of considerations, of which timing and speed can be taken as starting points, should you wish to wax enthusiastic in these areas!
Having said all these things, at Fort William we did not actually log the times relevant to our respective walks. However, we completed our walks in daylight by maintaining typical speeds of between 2 and 2½ mph and probably about 1½ mph when ascending Ben Nevis.
Track Files
If you are keen to see our walks superimposed on an Ordnance Survey® (OS) map or on another system such as Google Maps®, then you can use the following files - with dates as appropriate - to do so. 25, 26, 27 and 28. The data are based on WGS84. Of course, for copyright reasons, I do not show the OS-based or Google-based maps here.
Postscript
Any map is an approximate representation of what is. Practicality and scale are relevant considerations. We are not dealing with a planning application calling for detailed spatial descriptions of intricate boundaries. For us in the hiking community, the degrees of accuracy and precision should be just enough to give us useable and helpful knowledge of the terrain about us and beneath our feet. I hope my humble endeavours on this page are in this respect interesting for, and useful to, you my reader!
Original: 2017-11-26 @19:49
SAGAX REX HANC RETIS ORBIS PAGINAM PINXIT ANNO MMXVII
© Eric Scharf 2017