 |
MAPS & HEIGHTS 22 November 2015 |
|
| MAP HEIGHTS FIGURES GRAD'NTS EXTRA TIMING TRACK FINAL READ ME |
Features of Our Walk from Keston Church to Addington Hills
This 8.8 mile (14 Km) "linear" walk was ably led by Peter. The heights stayed within a band of 100 to 180 metres, but with a total ascent and descent of 223 and 212 metres respectively, there were quite a few "ups" and "downs", providing interest and good exercise. Walking weather was favourable, with temperatures between 0 and 5 degrees Centigrade, and sunshine for most of the day. It was just possible to complete the walk within the daylight constraints at this time of year, provided that the sojourn at the pleasant "White Bear" was kept in bounds.
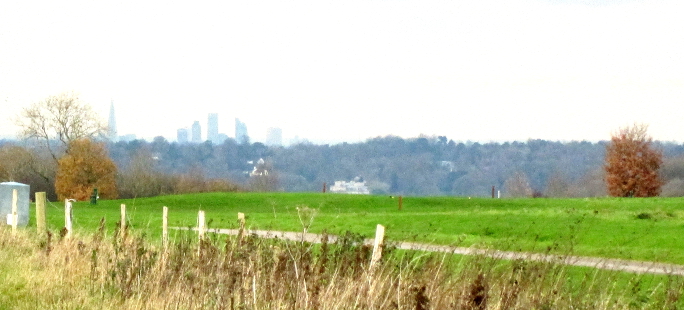
During the walk and at the end of the walk,
there were good views towards the southern reaches of London.
Now prepare ye for some plots and graphs. Not too overwhelming, but hopefully quite interesting! You will see here:
- An Outline Map of Our Walk
- Height Profile of Our Walk
- Some Facts and Figures
- Average Rising and Falling Gradients
- Less Quantifiable Considerations
- Timing & Speed
- Track File
- Postscript
Outline Map of Our Walk from Keston to Addington Hills
Our linear walk was roughly "U-shaped". In the map, the minus signs for the longitude angles indicate "degrees west of Greenwich". In fact, our walk straddled the Greenwich meridian. The map grid scales translate to 1.112 Km per 0.01° latitude and a mean of 0.689 Km per 0.01° longitude, all when using 6371.0 Km as the volumetric mean radius of the earth - as per the WGS84 standard!
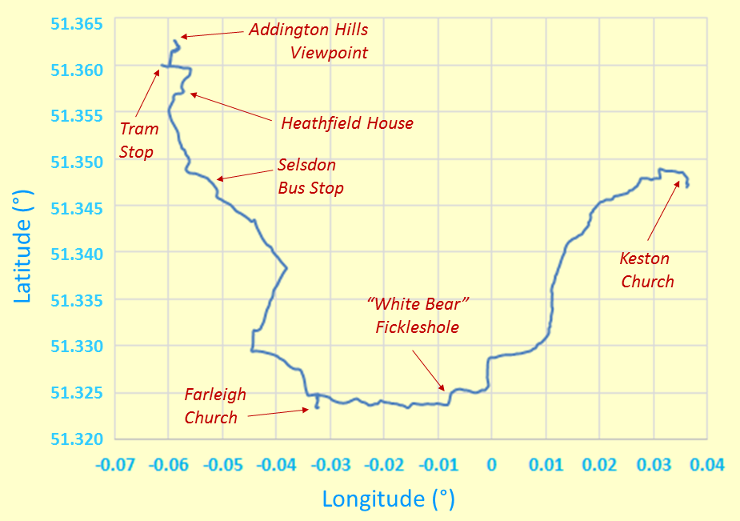
Outline Map of Walk
I plotted our walk by hand on my return home. Of course, I tried to be reasonably accurate. Even OS maps, on which I based my plot, may not show all the required detail, but appear to give the requisite degree of accuracy in this case.
Because we don't live on a flat earth - unless you are a convinced "flat-earther" - maps are inevitably a distortion of what is. In other words, it's all a matter of mapping a curvaceous surface onto a flat surface. We don't want to carry curvaceous representations of the terrain on our walks, do we? In our case, the northern length of our map grid is stretched out by something like an extra 0.20 %, to make it the same on the page as the length of the southern part of our map grid. Not that much for hiking purposes really! Can't complain.
Height Profile of Our Walk
It's of course fine to say that we reached about 178 m, but what's the significance of that? I mean, we started at 133 m and finished at 144 m. Probably, of greater interest when it comes to considering personal achievements, is the total ascent, which usually requires greater effort than the descent. On today's walk, the total ascent was 223 m, which as expected, was greater than the difference of 75 metres between maximum and minimum heights above mean sea level.
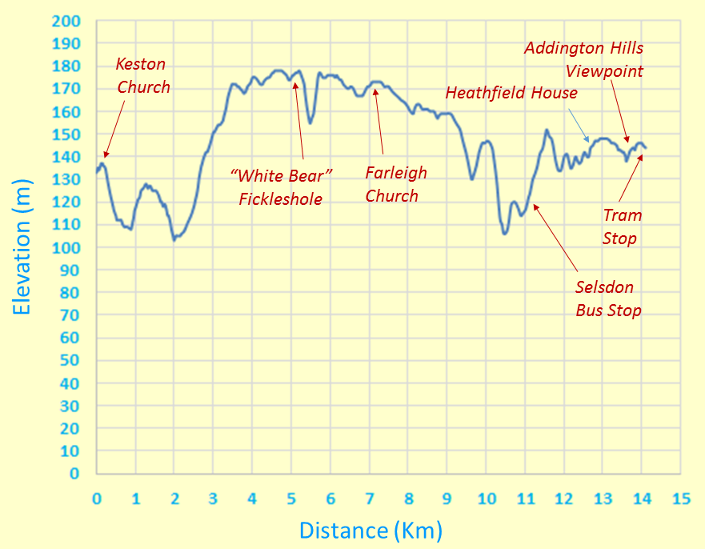
Height Profile
The above plot uses a true origin for the vertical elevation (height) axis, so as not to lose track of reality. What a worthy aim!
Some Facts and Figures
Here are some "vital statistics" in metric and imperial units. The total length of the walk is measured on a conceptual "flat" plane at mean sea level, WGS84 style. Of course, as mentioned above, the total ascent exceeds the difference between maximum and minimum elevations; I'd suspect things, if the reverse transpired!
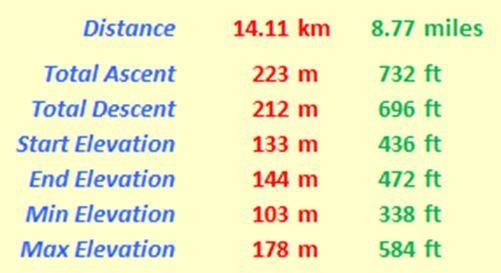
"Walk facts and figures"
Average Rising and Falling Gradients
And here, for the numerical fun of it, are the average gradients we overcame on our walk. The rising and falling (negative) gradients are both averaged over the distance given, with level stretches having rises and falls of less than ± ½ metre.
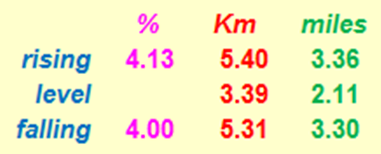
Rising and Falling Gradients
By comparison, Hertfordshire County Council recommends that its roads should not have longitudinal gradients of more than 5% and one of the steepest adhesion railways in the world, in Austria, has a maximum gradient of 11.6%. By way of further interest, the clockwise route of the Fairfield Horseshoe in the Lake District has a total distance of 15.62 Km (9.71 miles), with the following calculations: an average rising gradient of 14.66% over 6.589 Km, a level part over 0.345 Km, and an average falling gradient of 11.11% over 8.676 Km. This is seen by many as really quite challenging - but then, when you compare it with our walk, it can be said that we had a more leisurely and less demanding aim compared with Lakeland challenges!
Less Quantifiable Considerations
On any walk there are considerations which are very real but tantalizingly out of ready reach of those who wish to espouse a numerical approach to many of life's activities. Here are three considerations for starters.
- Weather: We had good walking weather. It stayed dry and for most of the day (i.e. until about 2pm) it was sunny. The temperature ranged between 0°C and 6°C - excellent for walking!
- Ground Conditions: It was quite muddy in places, but not enough to impede our progress. We are seasoned walkers after all!
- Signposting: This was mainly of the type "here's a bridle path" or "here's a foot path" or "here's the Vanguard Way", or even, "here's the Addington Boundary". Actual destinations were not over liberally sprinkled amongst the sign post population, but some of us had maps anyway! However, the Vanguard Way and the London Loop were generally clearly marked within woods. A major exception was that nowhere, not even on the map, was the point of divergence between the Vanguard Way and the London Loop actually marked, but this is not an issue to deter experienced hikers who can take many things in their "stride"!
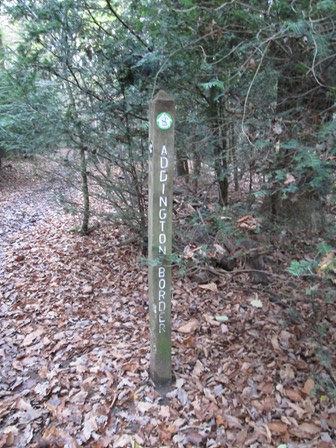
Long Distance Paths and Boundaries
were helpfully frequently marked, especially within woods.
Timing and Speed
It's one thing to discuss the terrain over which we walk. It's quite another to ask how we personally respond to walking over that terrain. There are a number of considerations, of which timing and speed can be taken as starting points.
- Timing: The walk started at 11:15, which allowed for a comfortable start, considering the need for Sunday morning travel. The finish time of 16:20 coincided with nightfall. It was late autumn after all!
- Speed: If the walk started at 11:15 and finished at 16:20, with 35 min for the lunch break, this gives 4½ hours actual walking time. For a distance approaching 9 miles, we then get a walking speed approaching 2 mph. This is less than your average walking speed of 2½ mph, but allows for more comfort, socialising and appreciation of the landscape. Very nice!
Track File
If you are keen to see our walk superimposed on an Ordnance Survey® (OS) map, then you can use the following file to do so. As mentioned above, the numerical data in this file have been hand-plotted by me (no GPS!) on my return home. The data are based on WGS84. Of course, for copyright reasons, I do not show the OS-based map here.
Postscript
Any map is an approximate representation of what is, and my plotting thereon certainly is. Practicality and scale are relevant considerations. We are not dealing with a planning application calling for detailed spatial descriptions of intricate boundaries. For us in the hiking community, the degrees of accuracy and precision should be just enough to give us useable and helpful knowledge of the terrain about us and beneath our feet. I hope my humble endeavours on this page are in this respect interesting for, and useful to, you my reader!
Eric Scharf
Original: 2015-11-26 @12:29
SAGAX REX HANC RETIS ORBIS PAGINAM PINXIT ANNO MMXV.
© Eric Scharf 2015