 |
Llangollen MAPS & HEIGHTS 13-20 July 2018 |
|
| Where ? Walks Map Heights Figures Weather Timing Tracks Finally Read Me |
Features of Our Walks from Llangollen
Llangollen's Dee Valley (Glyn Dyfrdwy) and the mountains on either side were the focus of our walks. We stayed in Llangollen and our expeditions on foot ranged from Corwen, about 13½ miles on foot to the west, to the Trevor aqueduct, about 5 miles to the east. We also took in Vivod Mountain (555 m) to south and Moel Morfydd (525 m) to the north. Sandstone, hardened into "Millstone Grit", features in the Vale of Llangollen although Limestone is also present.
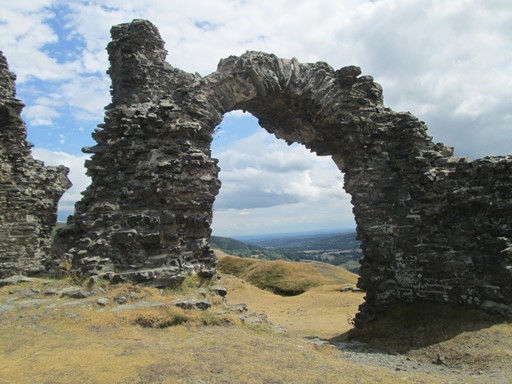
Most of us scaled the modest heights of Castel Dinas Brân (320 m), the "Crow Castle City" to the north of Llangollen, and enjoyed the distant views all round. The "Castell" is steeped in myths and legends, as any self-respecting set of ruins should be. In the second half of the 13th Century the "Castell" played an important role in the military encounters between the Welsh and the English.
For most of our stay we had sunny weather. However, because of the temperature and humidity, we were modest with our daily walking plans. Nonetheless, we all agreed that we had had an enjoyable time in Llangollen
Now prepare ye for some plots and graphs. Not too overwhelming, but hopefully quite interesting! You will see here:
- Where is Llangollen?
- An Outline Map of Our Walks
- Height Profiles of Our Walks
- Some Facts and Figures
- Weather, Ground Conditions & Signposting
- Timing & Speed
- Track Files
- And Finally
Where is Llangollen?
Llangollen, known for the - now international - annual Eisteddfod, is in the County of Denbigh, in North Wales. The town is on the old A5 from London to Holyhead and is south of the North Wales Coast and east of Snowdonia.
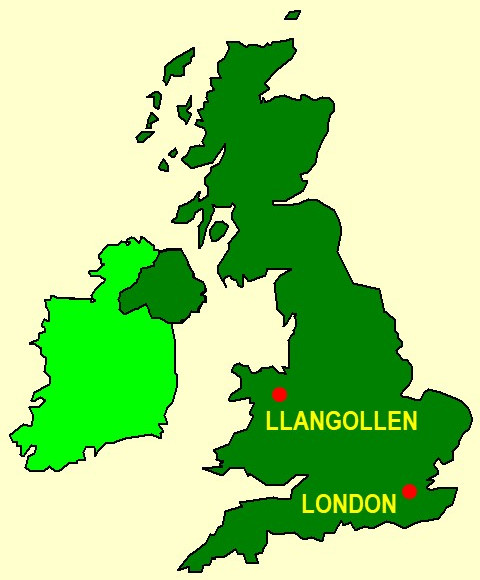
Here you see a "sketch" of the U.K. showing the approximate locations of Llangollen and London.
This "map" is from the Microsoft® PowerPoint® Clip Art Library originally supplied with versions of MS_Office®.
If you espouse the quantitative in life, we have some numbers for you! What are these "great circle distances"? If you haven't met these before, I try, in my humble way, to give a little bit of an explanation below. However, this is probably not the place to wax unduly on the subject!
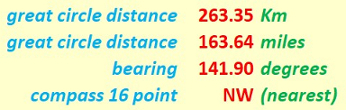
If you espouse the quantitative in life, here you duly see some numbers!
Our "straight line" distances are actually "great circle" distances on the earth's surface. We assume the earth to be spherical, which is not far off the mark. Assuming the earth to be a sphere gives us a maximum error of about 0.1% in our distance values. Not that much really! Can't complain! Indeed, we can speak of the distances as the "hypothetical crow" (cornix hypothetica) flies.
Cornix Hypothetica, our hypothetical crow,
isn't any old bird, as we should know.
Cornix Hypothetica! Many miles for us you go,
with many a "straight line" o'er Earth to show.
Just below you will see an outline map which shows the Dee Valley (Glyn Dyfrdwy) around which our walks took place. Vivod Mountain (555 m), Moel Morfydd (525 m), Castell Dinas Brân (320 m) and the Trevor Aqueduct (Pont Cysyllte) all featured on our walks. The heritage steam railway (Llangollen Steam Railway) provided a scenic way on which to reach the start of, or to return from, some of our walks.
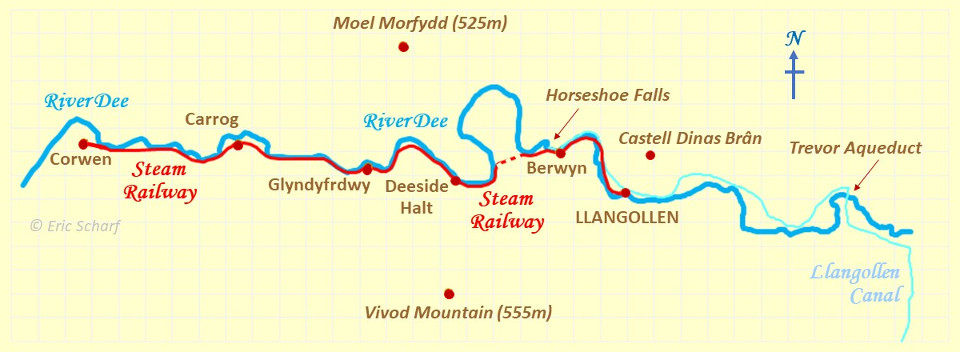
Our Walking Area - The Dee Valley (Glyn Dyfrdwy)
Outline Map of Some of Our Walks from Llangollen
There were at least eight walks on our Llangollen visit. Here you see four walks, two of which I led (July 14 and 16) and two of which I did solo on subsequent days (July 17 and 19). The walk on July 17 is similar to the walk some did on Sunday, July 15. In the map, you will see that three of the walks in the above map are circular. Numbers, in "bus route" fashion, refer of course to the day of the actual walk. Colours of numbers and routes are made to agree for clarity! The same goes for the height plots in the next section below. "Golden arrows" indicate the direction of a walk. Where the paths on successive days, such as the two over Castel Dinas Brân, overlap, the colour of the latest walk takes priority - because of the way my spreadsheet works!
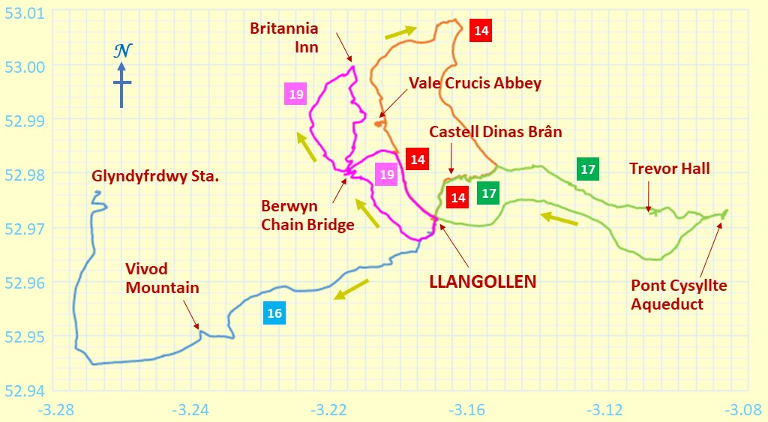
Outline Map of Our Walks
Y and X axes are in degrees latitude and longitude respectively.
The map grid scales translate to 1.112 Km per 0.01° latitude and a mean of 0.670 Km per 0.01° longitude, all when using 6371.0 Km as the volumetric mean radius of the earth - as per the WGS84 standard! In Scales, in the Lake District, the longitude scale is less (as expected), with a mean of 0.644 Km per 0.01° longitude; in fact, in doesn't take too much brain power to conclude that in Scales the distance is 26 metres per 0.01° longitude less than in Llangollen!
Because we don't live on a flat earth - unless you are a convinced "flat-earther" - maps are inevitably a distortion of what is. In other words, it's all a matter of mapping a curvaceous surface onto a flat surface. We don't want to carry curvaceous representations of the terrain on our walks, do we? In our case, the northern length of our map grid is stretched out by an extra 0.16 %, to make it the same on the page as the length of the southern part of our map grid. Not that much for hiking purposes really! Can't complain.
Height Profiles of Our Walks
It's of course fine to say that we reached about 555 m above sea level, but what's the significance of that? Probably, of greater interest when it comes to considering personal achievements, is the total ascent (which usually requires greater effort than the descent). On the four walks shown here, the total ascent varied from one walk to the next in a range of about 1 Km down to about ⅔ Km. The starting elevations were 91 m (14 and 16 July) and 83 m (17 and 19 July). The total ascent was, as expected, was greater than the difference of between maximum and minimum heights above mean sea level as defined by the OS® reference at Newlyn in Cornwall.
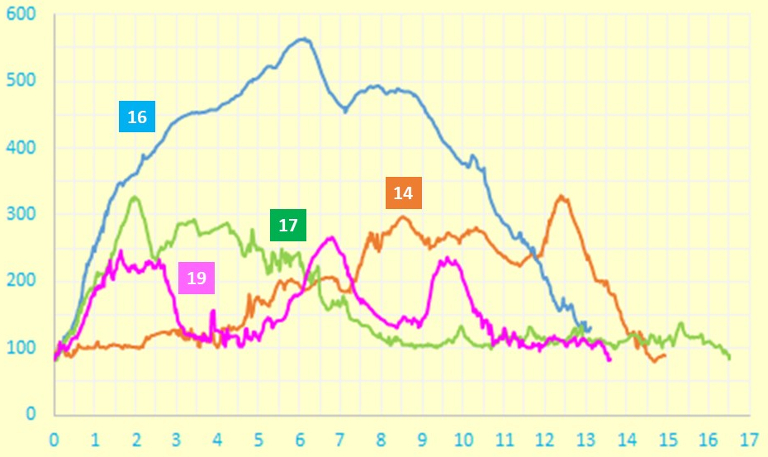
Height Profile
X and Y axes are in units of metres and kilometres respectively.
The above plot uses a true origin for the vertical elevation (height) axis, so as not to lose track of reality. What a worthy aim!
Some Facts and Figures
Here are some "vital statistics" in metric and imperial units. The total length of the walk is measured on a conceptual "flat" plane at mean sea level, WGS84 style. Of course, as mentioned above, the total ascent exceeds the difference between maximum and minimum elevations; I'd suspect things, if the reverse transpired!
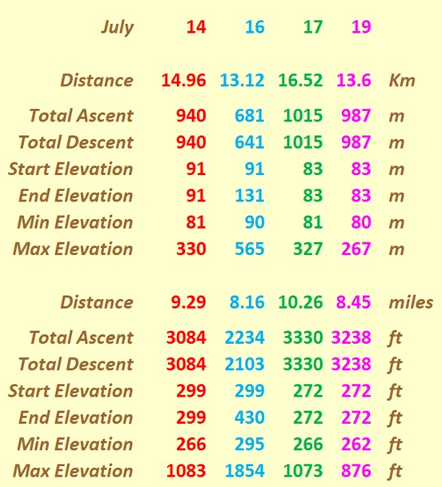
"Walk facts and figures"
Each route was derived using my GPS (Garmin®). Hence, the distances for each walk will include some walking at about at places of interest; therefore, for each walk, these distances may be about ½ Km above "true". However, all the results shown on this page are for indicative purposes and do not aspire to the heights of scientific accuracy, however precise the results may be!
Weather, Ground Conditions & Signposting
On any walk there are considerations which are very real but tantalizingly out of ready reach of those who wish to espouse a numerical approach to many of life's activities. Here are three considerations for starters.
- Weather: It stayed dry (i.e. zero precipitation) on Saturday and Sunday. However, it was hot and sultry on these days, with temperatures reportedly touching 28°C. There was rain later on Monday. These conditions were not ideal for walking, especially on exposed mountain tops. We thus considered more carefully than usual the length and height associated with any walk we undertook. Cloggies are an enterprising crowd, and we nevertheless got in some pleasant walks. The table below
is derived from the "Accuweather" web site.
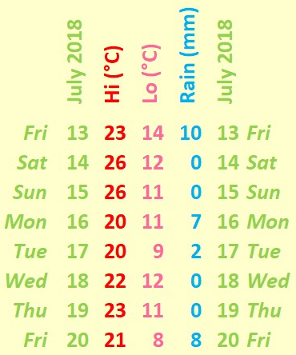
"Weather"
Staying with the theme of elevated temperatures and sultry conditions (such as we experienced in Llangollen), there was the true case of someone in a well-known walking club who said that he likes to go up mountains very quickly. Asked what was the typical cause of demise of his relatives, he replied, "Heart Attacks". Considering the undoubted seriousness of heart attacks, my humble thoughts are that the hot and sultry weather, which we experienced, favoured reaching the higher reaches of the landscape at a modest pace rather than trying to aspire to being a "one-minute miler". That is another of my ultra-humble opinions - for what it's worth! - Ground Conditions: It had been quite hot for the last few weeks, so there was hardly any mud.
- Signposting: The main walking routes, such as the Dee Valley Way, the Clwydian Way and the North Berwyn Way were well marked, as were most of the connecting paths and bridle ways.
Timing and Speed
It's one thing to discuss the terrain over which we walk. It's quite another to ask how we personally respond to walking over that terrain. There are a number of considerations, of which timing and speed can be taken as starting points. If you wanted to, you could, for each walk, ascertain start and end times and times spent not walking (e.g. for lunch). Knowing the total distance covered in the walk and time spent actually walking, you obviously can determine the speed, which typically is about 2½ mph for a walk on flat terrain, reducing to (e.g.) 1½ mph on a more challenging terrain. I probably would not find too many takers for this information were I to calculate it accurately and precisely for each of the four walks described here!
Track Files
If you are keen to see our walk superimposed on an Ordnance Survey® (OS) map, then you can use the following files to do so. The data in these files were recorded by my GPS (Garmin®). The data are based on WGS84. Of course, for copyright reasons, I do not show the OS-based maps here. Furthermore, the plot may also include some walkabouts in hostelries and sightseeing places; hence there may be a slight over estimation of the length of a walk by perhaps 0.5 Km.
Here are my Llangollen walks for July: 14, 16, 17 and 19.
And Finally - a Matter of Practicality
Any map is an approximate representation of what is. Practicality and scale are relevant considerations. We are not dealing with a planning application calling for detailed spatial descriptions of intricate boundaries. For us in the hiking community, the degrees of accuracy and precision should be just enough to give us useable and helpful knowledge of the terrain about us and beneath our feet. I hope my humble endeavours on this page are in this respect interesting for, and useful to, you my reader!
Eric Scharf
Version: 2018-09-19 @19:18
SAGAX REX HANC RETIS ORBIS PAGINAM PINXIT ANNO MMXVIII.
© Eric Scharf 2018