 |
WALK FEATURES Savouring Minehead's Landscape 25th - 28th August 2017 |
|
| WHERE ? OUR WALKS MAP HEIGHTS FIGURES TRACKS FINAL READ ME |
Features of Our Walks
Our walks took us through the varied landscape that characterizes this picturesque part of the Exmoor National Park, straddling Somerset and Devonshire. The rugged coast line between Porlock and Minehead and the hillier inland paths reaching the historic villages of Dunster, Porlock and the highest point in Somerset, namely Dunkery Beacon (519 m), all echoed to the sound of our eager footsteps!
All this, excellent weather and good walking conditions underfoot made for an unforgettable CLOG away break.
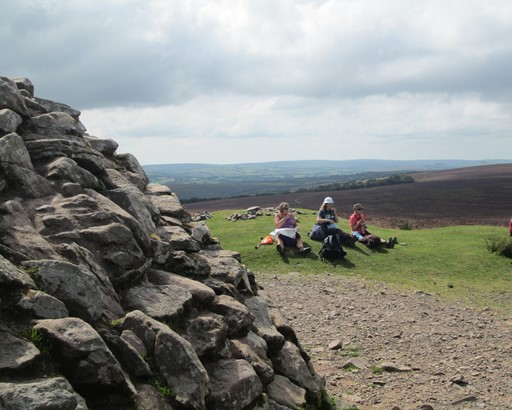
We scaled all 519 metres of Dunkery Beacon, the highest point on Exmoor and in Somerset.
Weather excellent. All-round views fantastic!
Definitely time for a lunch break!
Now prepare ye for some plots and graphs. Not too overwhelming, but hopefully quite interesting! You will see here:
- Minehead in the National Context
- Minehead in the Local Context
- Summary of Our Walks
- Outline Map of Our Walks
- Height Profiles of Our Walks
- Some Facts and Figures
- Track Files
- Postscript
- Please Read Me! Thankyou!
Minehead in the National Context
How far from London? Our residence in Minehead was about 106 miles from the centre of London and close to due west therefrom. The centre of London is officially taken as the intersection of The Strand, Whitehall and Cockspur Street. This intersection is often referred to as Charing Cross, not to be confused with the nearby Victorian Eleanor Cross itself, nor the station in front of which the cross stands. The detailed figures, for the fun of it, are as shown below.
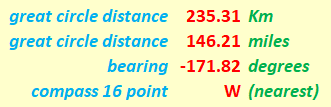
"Base Lodge" in Minehead is about 146 miles and roughly west from Charing X in London.
Waxing a tad technical. Our "straight line" distances are actually "great circle" distances on the earth's surface. In this case, we assume the earth to be spherical, which is not far off the mark. I mean, the shape of our Planet Earth - bumps, warts and all - is called a Geoid. However, the Geoid is far too "bumpy" a candidate for a universal system to be used by a GPS. So GPSs, and Sat Navs in general, use the WGS84 system, which assumes that the earth has the nice smooth regular shape of an ellipsoid; this shape is derived from the mean sea levels (more than one!) found on our Planet Earth. For rough and ready estimates of distance, a further simplification can be made by assuming that the earth has the shape of a sphere as opposed to an ellipsoid, and this simplification can give us a maximum error of about 0.1% in the distance values compared to those given by our GPS. Not that much really! Can't complain! Indeed, we can speak of the distances as the "hypothetical crow" (cornix hypothetica) flies.

Cornix Hypothetica, our hypothetical crow,
isn't any old bird, as we should know.
Cornix Hypothetica, many miles you'll fly,
drawing our "straight lines", in the sky.
Minehead in the Local Context
The map of the West Somerset Railway shows us how Minehead relates to the local area, especially to the Eastern part of Exmoor, and to the Quantocks and to Taunton. Interestingly, the train journey from Minehead to Bishops Lydeard is about 20 miles, making the West Somerset Railway one of the longer preserved heritage lines in Britain.
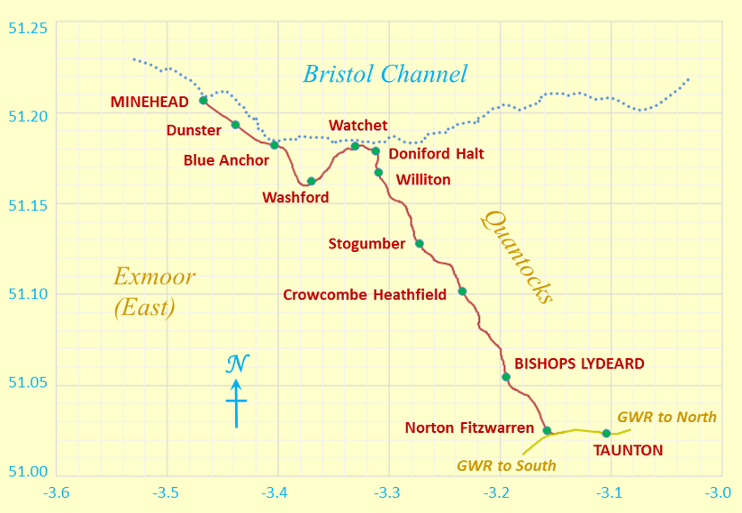
The West Somerset Railway is now a heritage line and links Minehead to much of the local area.
Degrees Latitude and Longitude feature on the Y and X axes respectively.
Our Walks
We got some respectable, yet leisurely, miles under our feet and managed to soak up a good proportion of the landscape that this corner of Somerset has to offer. Indeed, we accomplished our walks without undue reliance on transport - straight from our doorstep, so to speak.
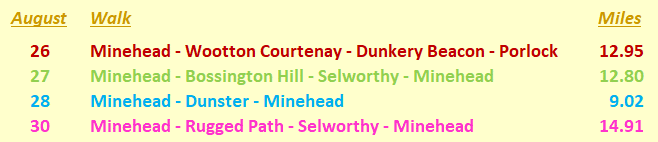
Our Walks in Overview.
We adhere to the colour coding for each day, in the subsequent sections below.
Just a short note here, for the record, as it were. For our walk on August 28 to Dunster Castle, we each had our individual walk schedules within the Castle and within the Church. Hence I have assumed, for simplicity, that our walk went to the main gate on the Castle and its grounds and the entrance to the church, and no further. In addition, for simplicity again, I have not included the fact that some of us actually entered the Castle grounds via the Mill, and not the Main Gate. Individual walks within Castle and church would, I estimated, add another 2½ miles (believe it or not!) to the total distance of just over 9 miles of our Dunster walk on Bank Holiday Monday, August 28.
Outline Map of Our Walks
The starting point for three of our walks on August 26, 27 and 28 was on our doorstep, the doorstep of Base Lodge in Minehead. On Sunday and Monday, this was also the end point. I was able to stay on until the morning of August 31 and was able to do a circular walk based on Minehead on August 30 as well. Minehead was small enough to allow us to reach the countryside very easily and quickly.
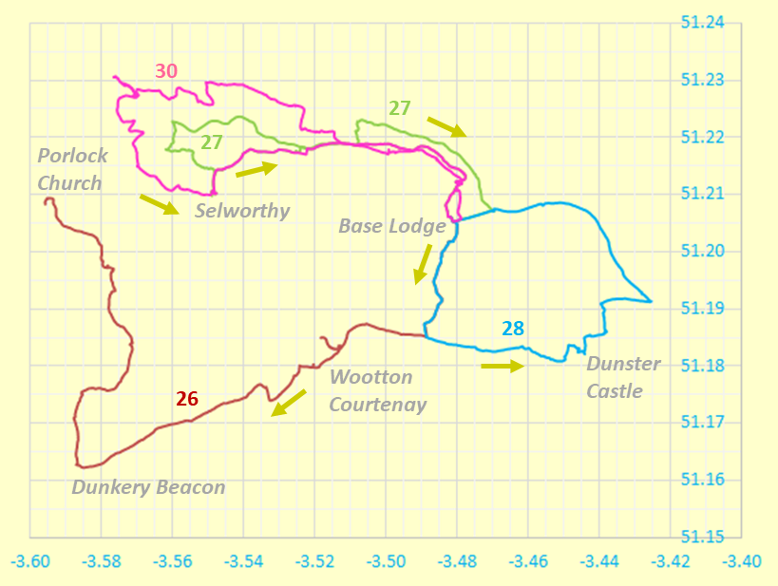
Outline Map of Our Walks.
Degrees Latitude and Longitude feature on the Y and X axes respectively.
Colour coding for the successive days is as in the "Our Walks" section above.
Map Distortion. Because we don't live on a flat earth - unless you are a convinced "flat-earther" - maps are inevitably a distortion of what is. In other words, it's all a matter of mapping a curvaceous surface onto a flat surface. We don't want to carry curvaceous representations of the terrain on our walks, do we? In our case, the northern length of our map grid is stretched out by something like an extra 0.20 %, to make it the same on the page as the length of the southern part of our map grid. Not that much for hiking purposes really! Can't complain!
Grid Scales. We were west of the Greenwich meridian; hence the negative longitude values. The map grid scales translate to 1.112 Km per 0.01° latitude and a mean of 0.697 Km per 0.01° longitude (WGS standard), both when using 6371.0 Km as the volumetric mean radius of the earth. It is interesting to compare the present longitude distance-to-degree ratio with that for other walks. It you do this, you will see that the further north you go, the less Km per degree longitude you get. Once you get to the Lake District the reduction in this ratio compared to that for walks in the south is quite noticeable. In Scales, in the Lake District, we already have a slightly smaller value of 0.644 Km per 0.01° longitude - a difference of 53 metres per 0.01° longitude compared with our Minehead walks.
Height Profiles of Our Walks
We reached our highest point at 519 m above mean sea level on Dunkery Beacon - as per our "Facts and Figures" just below, where the discrepancy between 519 and 523 m is also broached. Of course, maximum ascent and descent figures are normally greater than the maximum height attained. Indeed, it's the total ascent which gets closer to being a measure of our fitness, rather than the maximum height reached.
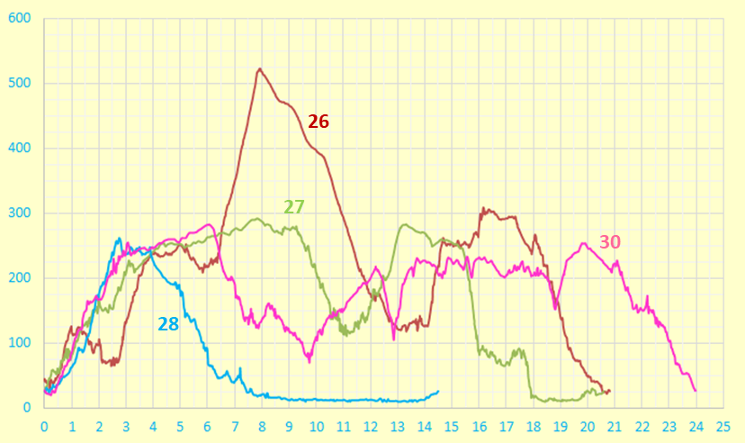
Height profiles for our walks.
Vertical (Y) and horizontal (X) axes are in metres and kilometres respectively.
Some Facts and Figures
Here are some "vital statistics" in metric and imperial units. If we look more closely at these figures, we can see that our starting heights for all four walks are the same (or almost the same) as expected, because we have the same starting point, namely the doorstep of Base Lodge. Similarly, the end points of the walks on August 27, 28 and 30 are essentially the same, as expected. The height of Dunkery Beacon in the figures below is 523 m, slightly more than the official 519 m; this is likely to be due to slight errors in the GPS system, or in the mapping tools I use to display the GPX file produced by the GPS system.
What about total ascent and descent? The walk to Selworthy on August 30, with a maximum height of 283 m, has a greater total ascent and descent than when scaling Dunkery Beacon (519 m) on August 26. Put another way, the height profile for the walk to Dunkery Beacon on August 26 is less jittery that the lower level walk on August 30 via the Rugged Path to Selworthy. In other words, it is not just a question of how far we walked or even how high we walked, but also of the amount of climbing and descending we had to do. So, for example, 20 miles on the flat can be less strenuous than 10 miles in hilly country, something of which fell walkers are well aware! Thus, on any given walk, the total ascent is probably a better measure of our fitness than the maximum height we reach.
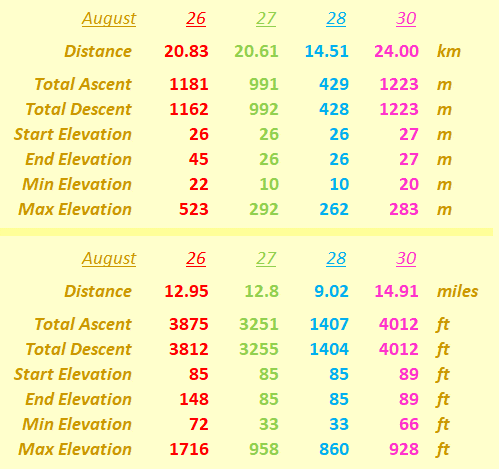
"Walk facts and figures"
It may be worth mentioning that the total length our walk is measured on the surface of the WSG84 spheroid. However, we can consider this, without undue loss of accuracy, as being on a conceptual "flat" plane at mean sea level, using the OS sea level reference as explained on OS "hiking" maps. There you are!
Track Files
If you are keen to see our walks superimposed on an Ordnance Survey® (OS) map or on another system such as Google Maps®, then you can use the following files for August 26, 27, 28 and 30 respectively, to do so. The data are based on WGS84. Of course, for copyright reasons, I do not show the OS-based or Google-based maps here.
Postscript
Any map is an approximate representation of what is. Practicality and scale are relevant considerations. We are not dealing with a planning application calling for detailed spatial descriptions of intricate boundaries. For us in the hiking community, the degrees of accuracy and precision should be just enough to give us useable and helpful knowledge of the terrain about us and beneath our feet. I hope my humble endeavours on this page are in this respect interesting for, and useful to, you my reader!
Original: 2017-09-26 @11:57
SAGAX REX HANC RETIS ORBIS PAGINAM PINXIT ANNO MMXI ET MMXVII
© Eric Scharf 2017