 |
Peak Rail MAPS & HEIGHTS 23 April 2019 |
|
| Where ? Map Heights Figures Timing Track File Finally Please Read Me |
Features of Peak Rail - Maps and Heights
Peak Rail is a heritage railway, presently extending for about 3½ miles (5⅔ Km) from Matlock in the south to the southern reaches of Rowsley. It lies about 100 metres above sea level and was once part of the Midland Railway's main line from London St Pancras to Manchester. It represents part of the Midland Railway's civil engineering effort through the hilly landscapes of Derbyshire and Yorkshire to reach destinations such as Manchester and Carlisle, destinations which competing railway companies had already reached by less arduous routes.
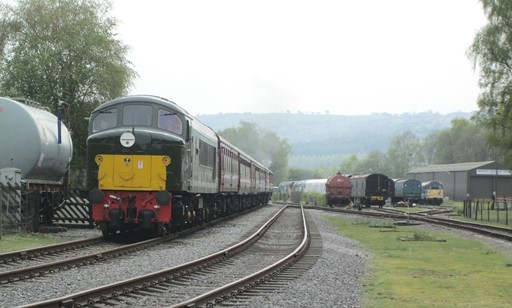
Here we at the present northern extremity of Peak Rail, namely Rowsley South Station. The train is top-and-tailed by an "Austerity" saddle tank and this "Peak Class" diesel. We are looking towards the south and Matlock, to which destination the train will shortly depart.
Now prepare ye for some plots and graphs. Not too overwhelming, but hopefully quite interesting! You will see here:
- Where is Matlock?
- An Outline Map of Our Walks
- Height Profile the Line
- Some Facts and Figures
- Track Files
- And Finally
Where is Matlock?
Matlock Station, is on the southern extremity of Peak Rail and on the northern extremity of the National Rail (East Midlands) line from Derby via Belper. Matlock is on the River Derwent and also lies roughly north of Belper and south of Chesterfield.
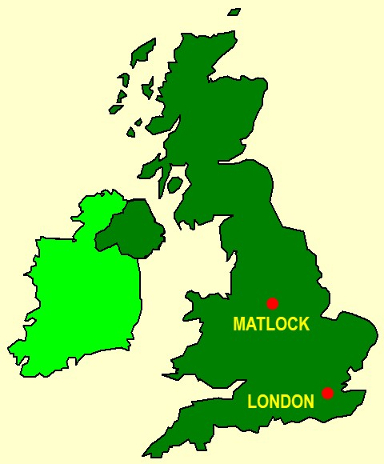
Here you see a "sketch" of the U.K. showing the approximate locations of Matlock and London.
This "map" is from the Microsoft® PowerPoint® Clip Art Library originally supplied with versions of MS Office®.
How far is Matlock Station from the centre of London? The centre of London is officially taken as the intersection of The Strand, Whitehall and Cockspur Street. This intersection is often referred to as Charing Cross, not to be confused with the nearby Victorian Eleanor Cross itself, nor the station in front of which the cross stands.
If you espouse the quantitative in life, we have some numbers for you! Our "straight line" distances are actually "great circle" distances on the earth's surface. We assume the earth to be spherical, which is not far off the mark. Assuming the earth to be a sphere gives us a maximum error of about 0.1% in our distance values. Not that much really! Can't complain! Indeed, we can speak of the distances as the "hypothetical crow" (cornix hypothetica) flies.
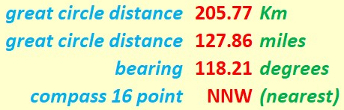
If you espouse the quantitative in life, here you duly see some numbers!

Cornix Hypothetica, our hypothetical crow,
isn't any old bird, as we should know.
Cornix Hypothetica! Many miles for us you go,
with many a "straight line" o'er Earth to show.
Outline Map of Peak Rail
Peak Rail strikes out roughly north west of Matlock Station for about 3½ miles (5⅔ Km). The line wends its way through the undulating countryside at the edge of the Peak District. There are presently, three main stations on the route, with Matlock Riverside on standby if needed.
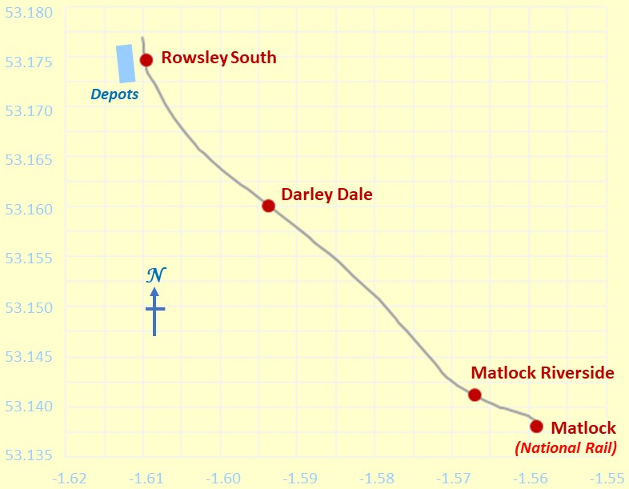
Outline Map of Peak Rail
Y and X axes are in degrees latitude and longitude respectively.
Negative values indicate degrees longitude WEST of Greenwich
The map grid scales translate to 1.112 Km per 0.01° latitude and a mean of 0.670 Km per 0.01° longitude, all when using 6371.0 Km as the volumetric mean radius of the earth - as per the WGS84 standard! In Scales, in the Lake District, the longitude scale is less (as expected), with a mean of 0.644 Km per 0.01° longitude; in fact, in doesn't take too much brain power to conclude that in Scales the distance is 26 metres per 0.01° longitude less than in Llangollen!
Because we don't live on a flat earth - unless you are a convinced "flat-earther" - maps are inevitably a distortion of what is. In other words, it's all a matter of mapping a curvaceous surface onto a flat surface. We don't want to carry curvaceous representations of the terrain on our walks, do we? In our case, the northern length of our map grid is stretched out by an extra 0.16 %, to make it the same on the page as the length of the southern part of our map grid. Not that much for our purposes really! Can't complain.
Height Profiles of Peak Rail
The track bed of Peak Rail is about 100 metres above sea level as defined by the OS® reference at Newlyn in Cornwall. The height plot below uses a true origin for the vertical elevation (height) axis, so as not to lose track of reality. What a worthy aim!
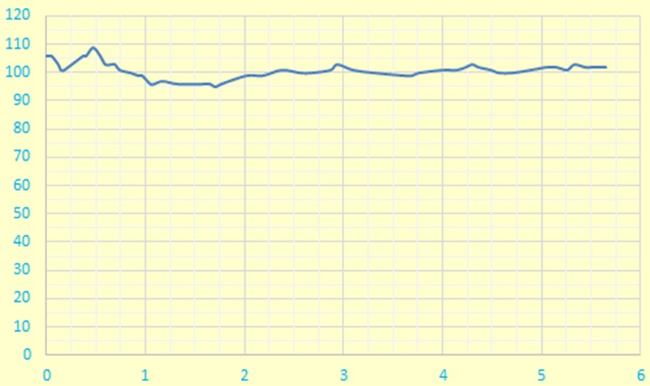
Height Profile
X and Y axes are in units of metres and kilometres respectively.
From the plot, we can get an estimate of two of the gradients. This could obviously be investigated more closely, but we should note that the estimation of gradients can generate numerical noise. Hence, what you see below should be seen as being purely indicative and should in NO way be considered as a basis for legal or technical purposes.
| items | set 1 | set 2 | |
| measured | height difference (m) | 9 | 14 |
| measured | distance 1 (Km) | 0.45 | 1.10 |
| measured | distance 2 (Km) | 0.20 | 0.45 |
| result | gradient (%) | 3.60 | 2.15 |
By comparison, Hertfordshire County Council recommends that its roads should not have longitudinal gradients of more than 5% and one of the steepest adhesion railways in the world, in Austria (Pöstlingberg, Linz), has a maximum gradient of 11.6%.
Some Facts and Figures
Here are some "vital statistics" in metric and imperial units. The total length of the railway is measured on a conceptual "flat" plane at mean sea level, WGS84 style. Of course, as mentioned above, the total ascent exceeds the difference between maximum and minimum elevations; I'd suspect things, if the reverse transpired!
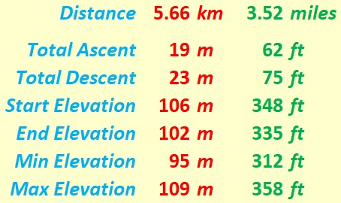
"Walk facts and figures"
I plotted the route at home, by hand, using Bike Hike UK. This gives the map, the heights and the "Facts and Figures", all of which you have just seen above. The accuracy will therefore depend on me! Of course, the results shown here are for indicative purposes and do not aspire to the heights of scientific accuracy, however precise the results may be!
Timing and Speed
The average speed for the 3.52-mile journey is just under 11 mph or 17 Km/hr. This is based on the timetable, which gives a total time of 22 minutes between Matlock and Rowsley South, with a 2-minute stop at Darley Dale.
Peak Rail is, I believe, subject to The Peak Rail Light Railway Order 1993. However, while a maximum speed of 25 mph (40.2 km/h) is often associated with the Light Railways Act of 1896, no speed limit is actually specified in this Act.
In short, the average speed estimated above, while well within the 25 mph frequently associated with the Light Railways Act of 1896, was, I found, perfectly satisfactory for my experience as a visitor!
Track File
If you are keen to see a "track" file superimposed on an Ordnance Survey® (OS) map, then you can use peakrail19 to do so. The data in this file, as already mentioned, have been plotted by me by hand, using the on-line Bike Hike UK® facility. Of course, for copyright reasons, I do not show the OS-based maps here. Don't worry that these files have "no style" or, put another way, that they "lack style information"!
And Finally - a Matter of Practicality
Any map is an approximate representation of what is. Practicality and scale are relevant considerations. We are not dealing with a planning application calling for detailed spatial descriptions of intricate boundaries. For us in the "ferroequinology" community, the degrees of accuracy and precision should be just enough to give us useable and helpful knowledge of the terrain about us and beneath the railway track. I hope my humble endeavours on this page are in this respect interesting for, and useful to, you my reader!
Eric Scharf
Version: 2019-08-02 @19:42
SAGAX REX HANC RETIS ORBIS PAGINAM PINXIT ANNO MMXIX.
© Eric Scharf 2019