 |
Rickmansworth to Chorleywood WALK FEATURES 21st May 2013 |
|
| WHERE ? MAP HEIGHTS FIGURES TIMING TRACK EXTRA FINAL READ ME |
Features of Our Walk
Our walk today, ably led by Melissa, took us through the gently undulating countryside in the furthest corner of south west Hertfordshire. It was a relaxing nine miles, with a maximum height difference below 80 metres. The two main gradients were quite modest and doable. Even though the sun was reticent, walking and weather conditions were good.
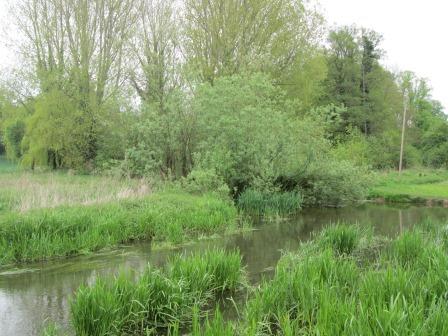
The River Chess glides gently through this tranquil outpost of south west Hertfordshire.
Now prepare ye for some plots and graphs. Not too overwhelming, but hopefully quite interesting! You will see here:
- How far were we from the Centre of London?
- Outline Map of Our Walk
- Height Profile of Our Walk
- Some Facts and Figures
- Less Quantifiable Considerations
- Timing & Speed
- Track File
- Postscript
- Please Read Me! Thankyou!
How far were we from the Centre of London?
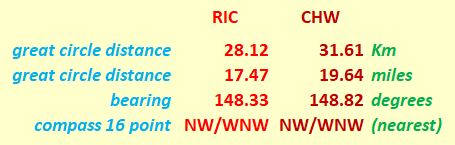
Our start and end points were Rickmansworth (RIC) and Chorleywood (CHW) stations respectively, which lie within a radius of a mere 20 miles, roughly between NW and WNW of the centre of London. The centre of London is officially taken as the intersection of The Strand, Whitehall and Cockspur Street. This intersection is often referred to as Charing Cross, not to be confused with the nearby Victorian Eleanor Cross itself, nor the station in front of which the cross stands. The detailed figures, for the fun of it, are as shown below.
The start and end points of our walk were
both within a 20 mile radius of the centre of London.
Our "straight line" distances are actually "great circle" distances on the earth's surface. We assume the earth to be spherical, which is not far off the mark. Assuming the earth to be a sphere gives us an error of about 0.1% in our distance values. Not that much really! Can't complain! Indeed, we can speak of the distances as the "hypothetical crow" (cornix hypothetica) flies.
Cornix Hypothetica, our hypothetical crow,
isn't any old bird, as we should know.
Cornix Hypothetica, many miles you'll fly,
drawing our "straight lines", in the sky.
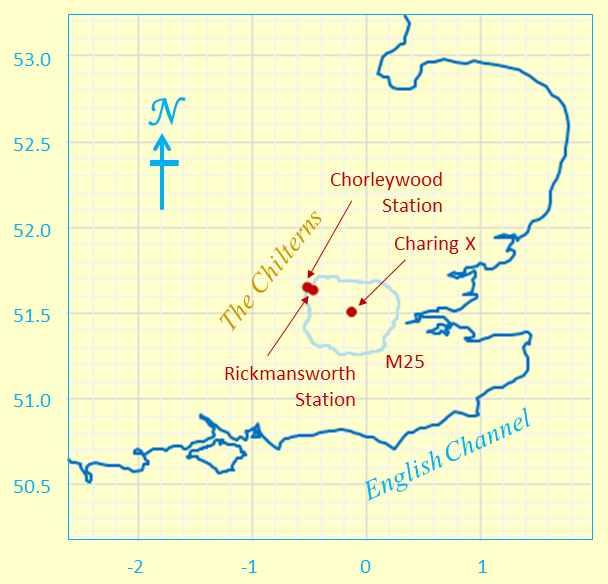
And here you can see the start and end points of our walk, namely
Rickmansworth (RIC) and Chorleywood (CHW) Stations, in the context of
(1) the South East of England, (2) the centre of London (Charing X) and (3) the M25.
Degrees Latitude and Longitude feature on the Y and X axes respectively.
Outline Map of Our Walk
Our walk was roughly in a north westerly direction, from Rickmansworth to Chorleywood, through the pleasant undulating landscape that characterises this extreme south west corner of Hertfordshire. The bank of the meandering River Chess provided a nice start to the walk and the village of Church End gave us that extra historical ingredient. Chenies itself, with its Manor, could provide an interesting extension to any future version of this walk. In Church End and Chenies we touched part of the Chiltern Way. With about 9 miles (13¾ Km) under our feet, we had a relaxing Tuesday walk with only two short, steepish ascents - both "very doable". Being May, we of course reached Chorleywood comfortably before nightfall.
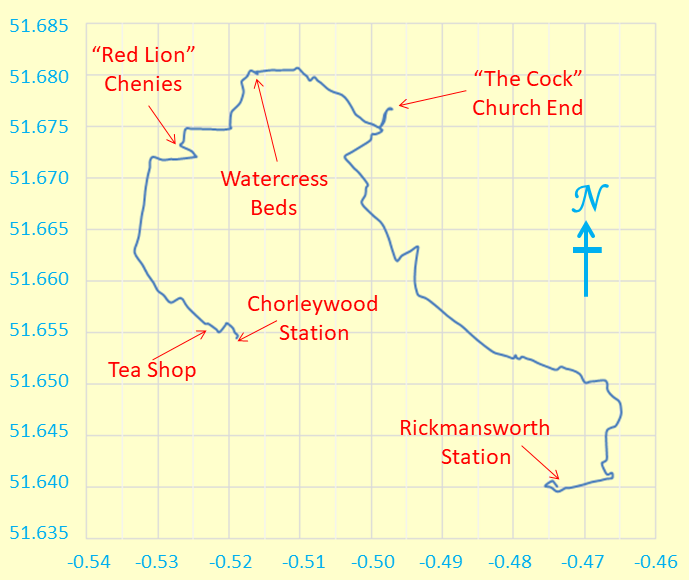
Outline Map of Our Walk.
Degrees Latitude and Longitude feature on the Y and X axes respectively.
Our walk is represented by the dark red line.
The dotted blue line represents the coast at mean sea level.
As you can see, our walk has a sort of horseshoe shape. The length I derived, tallied exactly with Melissa's initial estimate!
We were east of the Greenwich meridian. The map grid scales translate to about 1.112 Km per 0.01° latitude and a mean of 0.690 Km per 0.01° longitude (WGS standard), both when using 6371.0 Km as the volumetric mean radius of the earth. It is interesting to compare the present longitude distance-to-degree ratio with that for other walks. If you do this, you will see that the further north you go, the less Km per degree longitude you get. Once you get to the Lake District the reduction in this ratio compared to that for walks in the south-east is quite noticeable. In Scales, in the Lake District, we already have a slightly smaller value of 0.644 Km per 0.01° longitude - a difference of 54 metres per 0.01° longitude compared with our present Folkestone to Dover walk.
Because we don't live on a flat earth - unless you are a convinced "flat-earther" - maps are inevitably a distortion of what is. In other words, it's all a matter of mapping a curvaceous surface onto a flat surface. We don't want to carry curvaceous representations of the terrain on our walks, do we? In our case, the northern length of our map grid is stretched out by something like an extra 0.11 %, to make it the same on the page as the length of the southern part of our map grid. Not that much for hiking purposes really! Can't complain.
Height Profile of Our Walk
We reached our highest point (Maximum Elevation) at 127 m (417 feet) above mean sea level in Chenies, as per our "Facts and Figures" below, our difference between maximum and minimum heights being 76 metres, so not too demanding!. However, there were lots of intermediate ups and downs to give us the sort of exercise that we were after. This, of course, is compatible with our total ascent of 175 m (574 feet). Indeed, it's the total ascent which gets closer to being a measure of our fitness, rather than the maximum height reached.
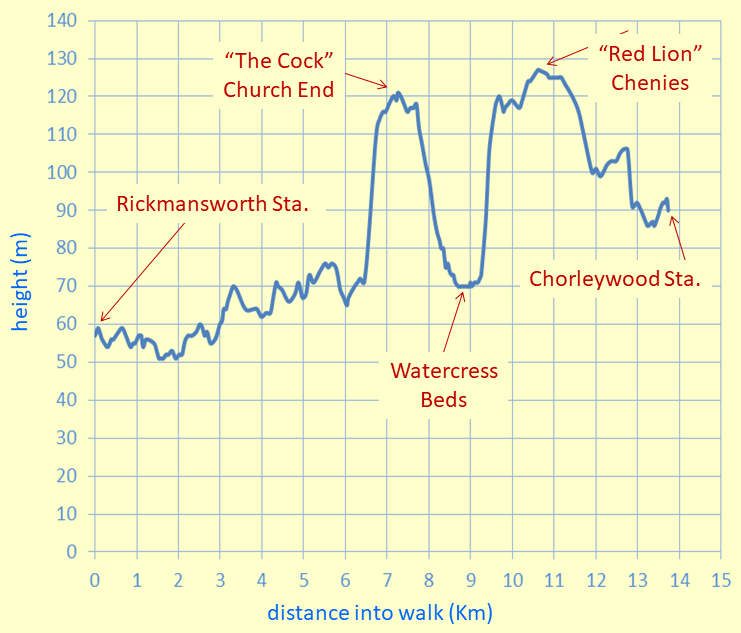
Height Profile
Units on the Y and X axes are metres and kilometres respectively.
Visual inspection of the height profile tells us that the gradients were not too demanding either, the steepest prolonged gradients on our walk being 13.6% and 16.7% respectively as given by the table just below. By comparison, Hertfordshire County Council recommends that its roads should not have longitudinal gradients of more than 5% and one of the steepest adhesion railways in the world, in Austria, has a maximum gradient of 11.6%.
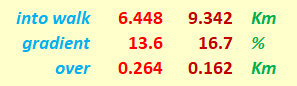
Maximum Gradients on Our Walk
Some Facts and Figures
Here are some "vital statistics" in metric and imperial units. The total length our walk is measured on the surface of the WSG84 spheroid. However, we can consider this, without undue loss of accuracy, as being on a conceptual "flat" plane at mean sea level, using the OS sea level reference as explained on OS "hiking" maps. There you are!
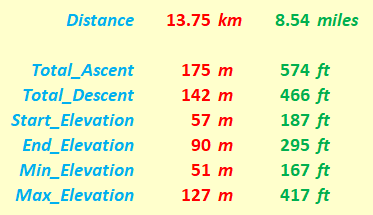
"Walk facts and figures"
Less Quantifiable Considerations
On any walk there are considerations which are very real but tantalizingly out of ready reach of those who wish to espouse a numerical approach to many of life's activities. Here are three considerations for starters.
- Weather: As the pictures show, we had good walking weather, cloudy yes with the sun being reticent, but dry. I don't have precise details to hand, but you might find these on the "Accuweather" web site.
- Ground Conditions: There were no muddy challenges.
- Signposting: Part of our walk touched the "Chilterns Way", which was quite well marked. Other markings were mainly of the nature "here's a footpath" or "here's a bridleway". However, we had OS® maps to tell us where we were headed.
Timing and Speed
It's one thing to discuss the terrain over which we walk. It's quite another to ask how we personally respond to walking over that terrain. There are a number of considerations, of which timing and speed can be taken as starting points, should you wish to wax enthusiastic in these areas!
However, having mentioned these aspects, my records don't give any further details, but I'm sure our walking speed hovered around, or just below, the "easy going" 2 mph mark.
Track File
If you are keen to see our walk superimposed on an Ordnance Survey® (OS) map or on another system such as Google Maps®, then you can use this file to do so. The data are based on WGS84. Of course, for copyright reasons, I do not show the OS-based or Google-based maps here.
Postscript
Any map is an approximate representation of what is. Practicality and scale are relevant considerations. We are not dealing with a planning application calling for detailed spatial descriptions of intricate boundaries. For us in the hiking community, the degrees of accuracy and precision should be just enough to give us useable and helpful knowledge of the terrain about us and beneath our feet. I hope my humble endeavours on this page are in this respect interesting for, and useful to, you my reader!
Original: 2017-07-28 @14:47; Last Updated: 2017-07-31 @09:55
SAGAX REX HANC RETIS ORBIS PAGINAM PINXIT ANNO MMXI ET MMXVII
© Eric Scharf 2017