 |
IOW - Totland Bay WALK FEATURES May 2018 |
|
| Features Where ? Maps Heights Numbers Ambient Timing Tracks Read Me |
Features of Our Walks
The Isle of Wight is about 23 miles east to west and 13¼ miles north to south, but we found that within that area there was plenty of scope for easy, as well as for more demanding, walks. The island landscape is based on chalk and is reminiscent of the South Downs on the mainland. Since we were based in Totland Bay, our walks were mainly centred on the west and the south of the Island.
In the Shanklin area, on the South East of the Island, we find the Island's highest ground, with a maximum height of 241 metres above sea level; here there are there are some demanding ascents. This is all good practice for those who espouse the "Great Outdoors"!
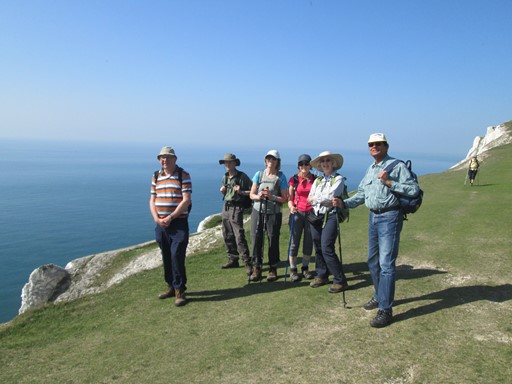
Here we are enjoying our walk from Totland Bay to Mottistone (National Trust Gardens).
We have come from the Tennyson Monument and our next stop is Freshwater Bay.
We had excellent weather, often without a single cloud in the sky. This also meant some fine sunsets in the evening at dinner time. Admittedly, the fine warm weather meant that during the day it was important to carry a reasonable supply of water on our walks!
Now prepare ye for some plots and graphs. Not too overwhelming, but hopefully quite interesting! You will see here:
- How far is Totland Bay from Home?
- Outline Maps of Our Walks
- Height Profiles of Our Walks
- Some Facts and Figures
- Less Quantifiable Considerations
- Track Files
- Postscript
- Please Read Me! Thankyou!
Where is Totland Bay, and how far is it from London?
Totland Bay is near the western tip of the Isle of Wight. Our hostel was 84 miles south west of the centre of London. Normal ferries from the mainland take about 40 minutes and of course this has to be added on to the rail journey of about 1½ to 2 hours from London Waterloo. For me, new to the Isle of Wight, the Solent Crossing was full of interest, so travel timings were for me not really an important consideration.
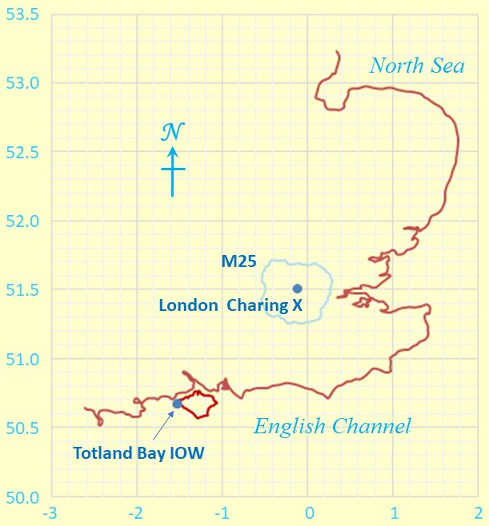
Our starting point on most days was Totland Bay YHA. We assume here the front door of the hostel. The figures you see here are based on a bit of Spherical Geometry. As reference, we take the centre of London, normally defined as the intersection of The Strand, Whitehall and Cockspur Street. This intersection is often referred to as Charing Cross, not to be confused with the Victorian Eleanor Cross itself nor the station in front of which it stands.
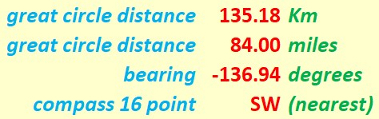
Totland Bay is 84 miles south-west of the centre of London.
Of course, distance and bearing are as the hypothetical crow (cornix hypothetica) flies. Our bird, of course, espouses the Great Circle route. For us mere earthlings the actual distance is of course longer, for, unlike our esteemed avian friend cornix hypothetica, we have the little issue of negotiating bumps, curves and sundry diversions in the landscape as we travel from A to B.
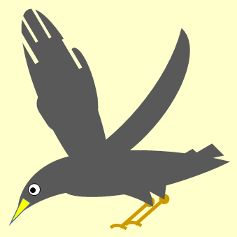
Cornix Hypothetica, our hypothetical crow,
Isn't any old bird, as we should know.
Cornix Hypothetica, many miles you'll fly,
Drawing our "straight lines", in the sky.
Outline Maps of Our Walks
First of all, here is a summary of the walks with relevant mileages. If you find the mileages too precise, and think there may be a possible conflict with the achievable accuracy (as opposed to precision), you are more than welcome to round the mileages, in your mind, to the nearest half mile! I can safely assure you that the mental effort in so doing is easily achievable for most of us - and certainly for "CLOGgies"! The mileage for the Mottistone walk is measured to the entrance of the NT Mottistone Gardens; walking around the gardens took up at least another half mile!
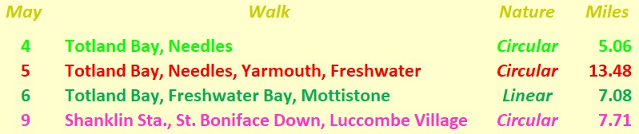
Walk Summary: Descriptions and Mileages.
As you see, three of the walks summarized here (above!) were circular; circularity, of course, often implies less bus journeys and can make the return correspondingly less constrained by timetables. Usually a good thing. Makes life that bit more relaxing! The other thing that you notice is that the distances were not that long. We wanted a relaxing time, especially as the weather was nice and warm!
Below you see the outline maps of our walks. I plotted the outline of the Isle of Wight by hand on my return home. The actual walks were recorded on my GPS (Garmin®). In the three following plots, the negative longitude values indicate degrees WEST of Greenwich. The numbers which appear in bus-route fashion, relate the walk to the particular day in May. The walk colours in the maps are the same as the colours used for the corresponding walks in the table above.
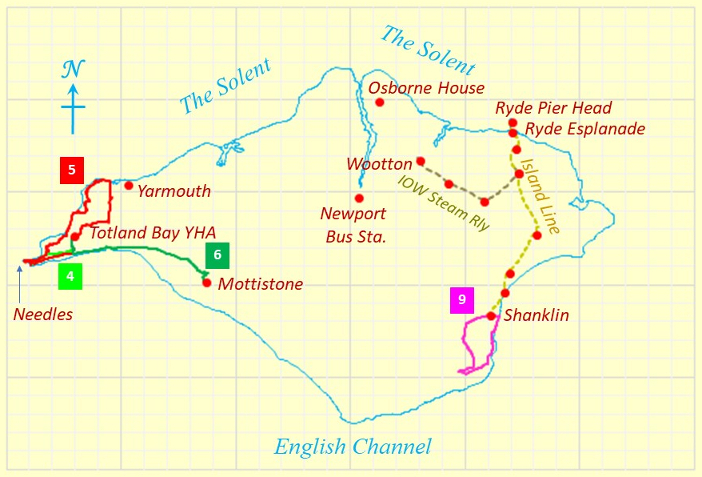
Outline Map of Our Walks and Other Visits on the Isle of Wight
Axes(°): Longitude -1.60 to -1.00 and Latitude 50.55 to 50.80
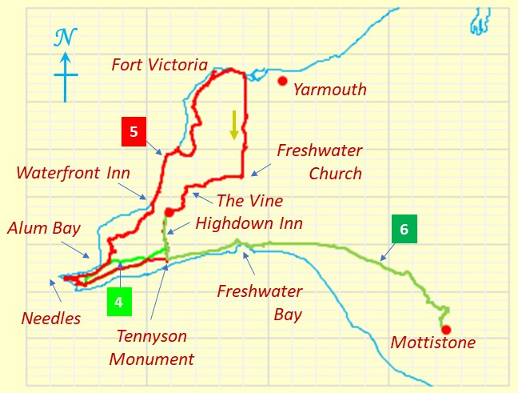
West Wight - where we were based.
Axes(°): Longitude -1.60 to -1.40 and Latitude 50.64 to 50.72
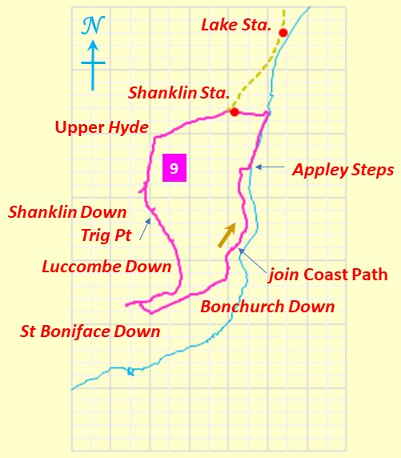
Shanklin: Circular Walk - Highest Point on Isle of Wight
Axes(°): Longitude -1.22 to -1.15 and Latitude 50.58 to 50.65
And now something which some of you may find quite interesting. The map grid scales here in the Outline Map of the Isle of Wight translate to 1.112 Km per 0.01° latitude and a mean of 0.705 Km per 0.01° longitude (WGS84 standard), both when using 6371.0 Km as the volumetric mean radius of the earth. Fine and potentially useful, but it is also interesting to compare the present longitude distance-to-degree ratio with that for walks in other parts of England. It you do this, you will see that the further north you go, the less Km per degree longitude you get. For example, in Guildford, south west of London, we already have a slightly smaller mean distance of 0.697 Km (as opposed to 0.705 Km) per 0.01° longitude. As you see, it's a difference of 8 metres per 0.01° longitude.
In addition, because we don't live on a flat earth - unless you are a convinced "flat-earther" - maps are inevitably a distortion of what is. In other words, it's all a matter of mapping a curvaceous surface onto a flat surface. We don't want to carry curvaceous representations of the terrain on our walks, do we? In our case, the northern length of our map grid - for the Outline Map of the Isle of Wight - is stretched out by something like an extra 0.53 %, to make it the same on the page as the length of the southern part of our map grid. Not that much for hiking purposes really! Can't complain. Of course, this stretching is less for the more detailed maps - just below the IOW map on this page - of the West Wight and Shanklin areas.
Height Profiles of Our Walks
The highest points on the walks described here were above Bonchurch and Saint Boniface Downs south of Shanklin - on walk NINE. The height profile below shows that for this walk there was essentially a plateau at about 230 metres. In West Wight, the maximum heights of the three walks (FOUR, FIVE and SIX ) were in the range 150 to 160 metres, and so noticeably lower than on the Shanklin circular walk. Of course, as in the outline maps, so here too in the height plots, the numbers and colours relate the walk to the particular day in May 2018.
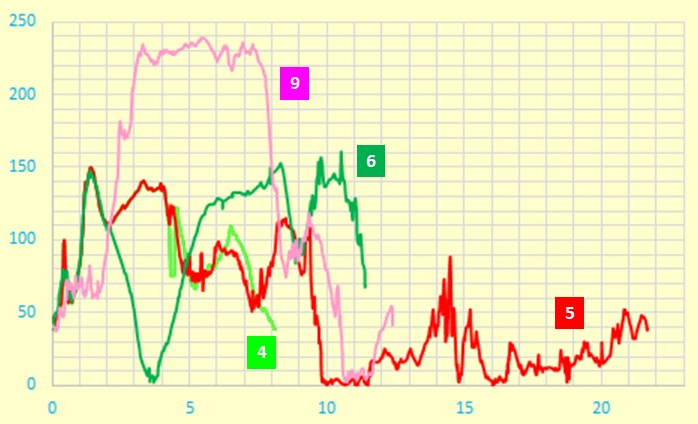
Height Profiles
Height in metres (Y-Axis) against Distance in Km (X-Axis)
Some Facts and Figures
Here are some "vital statistics" in metric and imperial units. The total length of the walk is measured on the surface of the WSG84 spheroid. However, as we saw above, we can consider this without undue loss of accuracy as being on a conceptual "flat" plane at mean sea level, using the OS® Newlyn sea level reference as explained on OS® "hiking" maps. There you are!
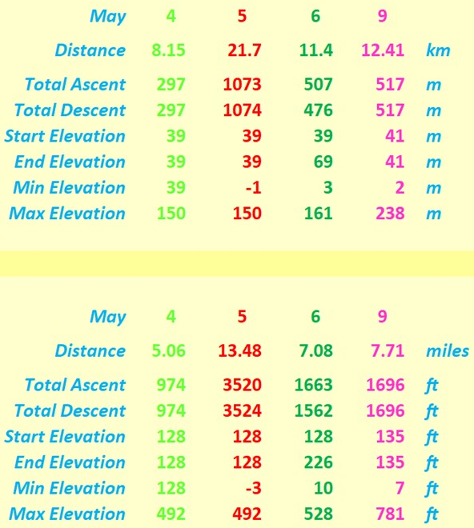
"Walk facts and figures"
It's of course fine to say that on our "Needles" walk on Saturday, 5th May, we reached about 150 metres above sea level and descended to sea level, but what's the significance of that? Probably, of greater interest when it comes to considering personal achievements, is the total ascent (which, incidentally, usually requires greater effort than the descent). For our Saturday walk, the total ascent and descent (same start and end point) was 1037 metres - a slight advance on ONE kilometre, which as expected, was greater than the difference of about 150 metres between maximum and minimum heights above mean sea level.
Incidentally, the Total Ascent and the Total Descent for our Saturday walk should be equal, but the descrepancy of about one metre is probably a function of my processing of the GPS readings! No panic, but you probably want to see my pictures. So I shan't hunt about for the odd metre, and shall concentrate instead on putting these pages on the web in a reasonably acceptable (I hope) form!
Less Quantifiable Considerations
On any walk there are considerations which are very real but tantalizingly out of ready reach of those who wish to espouse a numerical approach to many of life's activities. Here are three considerations for starters.
- Weather: We had sun and some very occasional cloud. It was quite warm but still good for walking. So good weather all round! I didn't have the chance to keep temperature readings, but why get too concerned with such figures when we are enjoying ourselves?
- Ground Conditions: These were good, with rarely any muddy sections.
- Signposting: This was often of the nature "here's a footpath" or "here's a bridleway". However, many of us, of course, had compasses and OS® maps to tell us where we were headed - preparedness is always a good ploy!
Timing and Speed
It's one thing to discuss the terrain over which we walk. It's quite another to ask how we personally respond to walking over that terrain. There are a number of considerations, of which timing and speed can be taken as starting points. I don't have the timings to hand for our walks, but some modest observations could be useful.
- Timing: We were only about 1½ months away from June 21, the longest day of the year, so we started and finished comfortably in daylight.
- Speed: Our speed was probably about 2 to 2½ mph. The terrain on the Isle of Wight is, of course, not as hilly as, for example, in the Lake District, and we aimed for a comfortable speed - nothing competitive! So there you are!
Track Files
If you are keen to see our walks superimposed on an Ordnance Survey® (OS) map or on another system such as Google Maps®, then you can use the GPX files below to do so, where the numbers correspond to the May dates. Don't worry if a "no style" statement surfaces!
- 4: Totland Bay - Needles - Circular - 5 miles
- 5: Totland Bay - Needles - Yarmouth - Freshwater - Circular - 13½ miles
- 6: Totland Bay - Freshwater Bay - Mottistone - Linear - 7 miles
- 9: Shanklin - St Boniface Down - Bonchurch Down - Circular - 7¾ miles
Postscript
Any map is an approximate representation of what is, and my plotting thereon certainly is. Practicality and scale are relevant considerations. We are not dealing with a planning application calling for detailed spatial descriptions of intricate boundaries. For us in the hiking community, the degrees of accuracy and precision should be just enough to give us useable and helpful knowledge of the terrain about us and beneath our feet. I hope my humble endeavours on this page are in this respect interesting for, and useful to, you my reader!
Eric Scharf
Original: 2018-06-03 @18:58
SAGAX REX HANC RETIS ORBIS PAGINAM PINXIT ANNO MMXVIII.