 |
Caterham to Westerham MAPS & HEIGHTS 11th August 2018 |
|
| Where ? Map Heights Figures Extra Timing Track Finally Read Me |
Features of Our Walk from Caterham to Westerham
This 14.6 mile (23.5 Km) "linear" walk was devised and ably led by Nick. The heights stayed within a band of 70 to 240 metres. However, with a total ascent and descent each of about 1.1 Km, there were quite a few "ups" and "downs", providing interest and good exercise. Walking weather was favourable, nice temperature, no rain and with a nice mixture of sunshine and clouds. It was still August and the day was "long", so there was no need to rush like fury. Why rush when you are enjoying yourself?
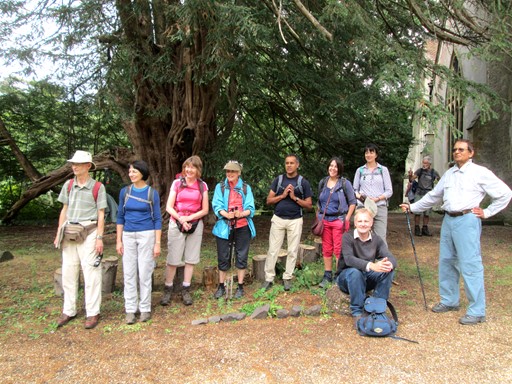
Here we are in Tandridge in front of the 1,500-year old yew tree outside the church.
The yew is probably the oldest in the country!
What has this yew witnessed over the centuries? Ah, if yews could tell!
Now prepare ye for some plots and graphs. Not too overwhelming, but hopefully quite interesting! You will see here:
- An Outline Map of Our Walk
- Height Profile of Our Walk
- Some Facts and Figures
- Extra, Less Quantifiable, Considerations
- Timing & Speed
- Track File
- And Finally
Where was Our Walk in the Context of the Centre of London?
We started our walk at Caterham Station (Network Rail Code: CAT) and finished our walk on the green in down town Westerham. These points are respectively almost 16 miles south and 19 miles south south east, from the centre of London. The centre of London is officially taken as the intersection of The Strand, Whitehall and Cockspur Street. This intersection is often referred to as Charing Cross, not to be confused with the nearby Victorian Eleanor Cross itself, nor the station in front of which the cross stands. The detailed figures, for the fun of it, are as shown below.
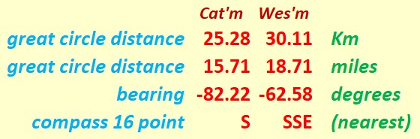
The start and end points of our walk were both within a 19-mile radius of the centre of London.
Our "straight line" distances are actually "great circle" distances on the earth's surface. We assume the earth to be spherical, which is not far off the mark. Assuming the earth to be a sphere gives us a maximum error of about 0.1% in our distance values. Not that much really! Can't complain! Indeed, we can speak of the distances as the "hypothetical crow" (cornix hypothetica) flies.

Cornix Hypothetica, our hypothetical crow,
isn't any old bird, as we should know.
Cornix Hypothetica! Many miles for us you go,
with many a "straight line" o'er Earth to show.
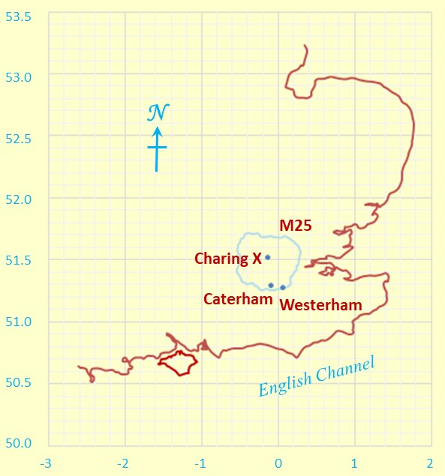
And here you can see the start and end points of our walk,
namely Caterham Station and Westerham Green, in the context of:
(1) the South East of England, (2) the centre of London (Charing X) and (3) the M25.
Degrees Latitude and Longitude feature on the Y and X axes respectively.
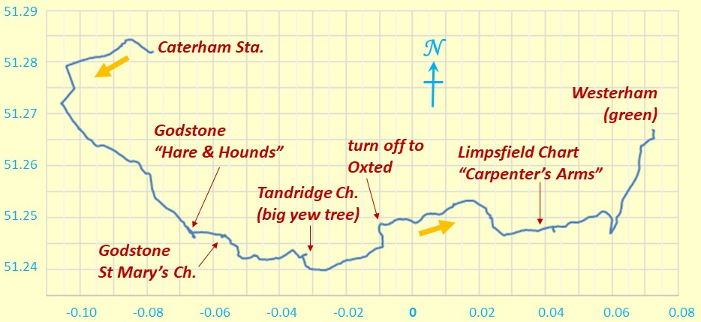
Outline Map of Our Walk from Caterham to Westerham
Our "linear" walk was in fact very roughly "U-shaped". In the map, the minus signs for the longitude angles indicate "degrees west of Greenwich". In fact, our walk straddled the Greenwich meridian. The map grid scales translate to 1.112 Km per 0.01° latitude and a mean of 0.696 Km per 0.01° longitude, all when using 6371.0 Km as the volumetric mean radius of the earth - as per the WGS84 standard! In Scales, in the Lake District, the longitude scale is less (as expected), with a mean of 0.644 Km per 0.01° longitude; in fact, it is 52 metres per 0.01° longitude less than in Caterham!
Outline Map of Our Walk
Y and X axes are in degrees latitude and longitude respectively.
Because we don't live on a flat earth - unless you are a convinced "flat-earther" - maps are inevitably a distortion of what is. In other words, it's all a matter of mapping a curvaceous surface onto a flat surface. We don't want to carry curvaceous representations of the terrain on our walks, do we? In our case, the northern length of our map grid is stretched out by an extra 0.17 %, to make it the same on the page as the length of the southern part of our map grid. Not that much for hiking purposes really! Can't complain.
Height Profile of Our Walk
It's of course fine to say that we reached about 240 m above sea level, but what's the significance of that? Probably, of greater interest when it comes to considering personal achievements, is the total ascent (which usually requires greater effort than the descent). On today's walk, the total ascent was 1.109 Km, which as expected, was greater than the difference of 166 metres between maximum and minimum heights above mean sea level.
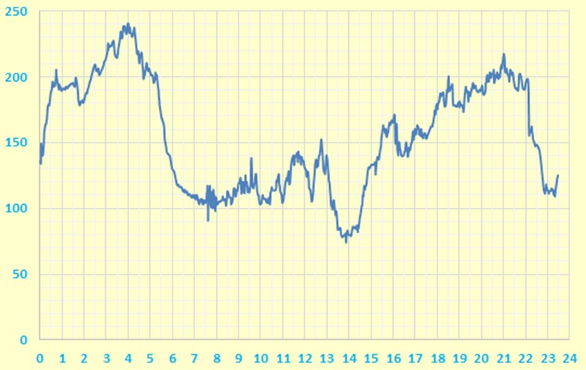
Height Profile
X and Y axes are in units of metres and kilometres respectively.
The above plot uses a true origin for the vertical elevation (height) axis, so as not to lose track of reality. What a worthy aim!
Some Facts and Figures
Here are some "vital statistics" in metric and imperial units. The total length of the walk is measured on a conceptual "flat" plane at mean sea level, WGS84 style. Of course, as mentioned above, the total ascent exceeds the difference between maximum and minimum elevations; I'd suspect things, if the reverse transpired!
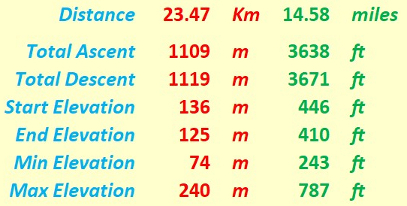
"Walk facts and figures"
Extra, Less Quantifiable, Considerations
On any walk there are considerations which are very real but tantalizingly out of ready reach of those who wish to espouse a numerical approach to many of life's activities. Here are three considerations for starters.
- Weather: We had good walking weather. It stayed dry (i.e. zero precipitation) and we had a pleasant mixture of sun and clouds. According to the "Accuweather" web site the temperature for Caterham ranged between a maximum of 19°C and a minimum of 8°C - excellent for walking!
- Ground Conditions: There was hardly any mud.
- Signposting: This was often of the type "here's a bridle path" or "here's a foot path". The Greensand Way (GSW) was reasonably well signposted. An exception was between Limpsfield and Westerham, where the "GSW" markers had in some places disappeared. Indeed, the turn off at Limpsfield Chart on to the Westerham Link was not signposted for the GSW at all. However, most of us had maps anyway! Always a good ploy for walks.
Timing and Speed
It's one thing to discuss the terrain over which we walk. It's quite another to ask how we personally respond to walking over that terrain. There are a number of considerations, of which timing and speed can be taken as starting points.
- Timing: The walk started at 10:30, which allowed for a comfortable start, considering the need to reach Caterham from various places in and outside (e.g. Essex) the capital. The finish time of about 18:30 was, for August, well before nightfall.
- Speed: If the walk started at around 10:30 and finished around 18:30 with about 2 hours for the lunch break and "sightseeing" stops, this gives about 6 hours actual walking time. For a distance of 14.58 miles, we then get a walking speed of about 2.43 mph. This is close to your average walking speed of 2½ mph. Very nice!
Track File
If you are keen to see our walk superimposed on an Ordnance Survey® (OS) map, then you can use the following file to do so. The numerical data in this file were recorded on my GPS (Garmin®). The data are based on WGS84. Of course, for copyright reasons, I do not show the OS-based map here. Furthermore, the plot may also include some walkabouts in hostelries and sightseeing places; hence there may be a slight over estimation of the length by perhaps 0.5 Km.
And Finally - a Matter of Practicality
Any map is an approximate representation of what is. Practicality and scale are relevant considerations. We are not dealing with a planning application calling for detailed spatial descriptions of intricate boundaries. For us in the hiking community, the degrees of accuracy and precision should be just enough to give us useable and helpful knowledge of the terrain about us and beneath our feet. I hope my humble endeavours on this page are in this respect interesting for, and useful to, you my reader!
Eric Scharf
Original: 2018-08-16 @18:22
SAGAX REX HANC RETIS ORBIS PAGINAM PINXIT ANNO MMXVIII.
© Eric Scharf 2018