 |
PATTERDALE OUR WALKS 2014: October 16 to 21 |
|
Our Walks
This short page says a few words about the maps, heights and distances related to the walks in which I participated. There were of course other activities, which fact serves to emphasise the flexibility of CLOG away-breaks. Now if you wish to dive straight into the pictorial aspects of our stay at Coniston, then you can, of course, always come back to this page.
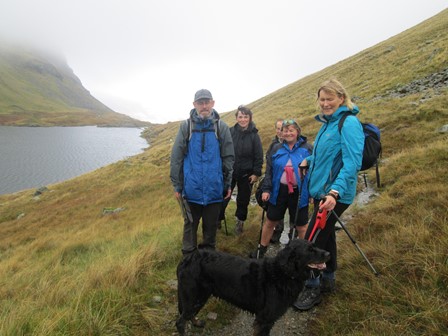
On our first full day (October 17) we scaled the heights
to Grisedale Tarn, at about 550 m, just below the cloud layer.
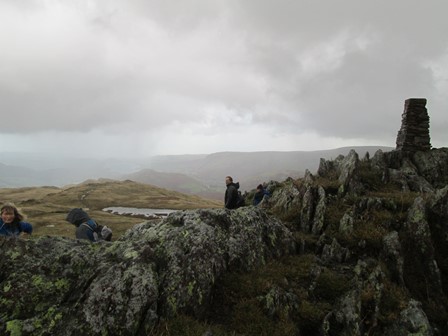
On our next full day (October 18) we had
a windswept but scenic experience on Place Fell (657 m).
Maps, Heights and Distances
All the five walks in which I participated, were circular, starting and finishing at our hostel, already at 185 m. This indicated what an excellent choice Patterdale was for walking and appreciating the mountains. Well done Ralph! The walks, in order of October date, and with the identifying colours ( ★ ★ ★ ★ ★ ) used below, are:
- ★ Arrival & Bordale Hause
- ★ Grisedale Tarn
- ★ Place Fell & Ullswater
- ★ Local Interlude
- ★ Raise & Sticks Pass
As mentioned, dates and colours are used below to distinguish the walks in the map and in the height plots and in the tables, which in turn, are given in metric and imperial units. The information given below relies, to a great extent, on my plotting accuracy - which is not perfect, but hopefully sufficient for the purpose!
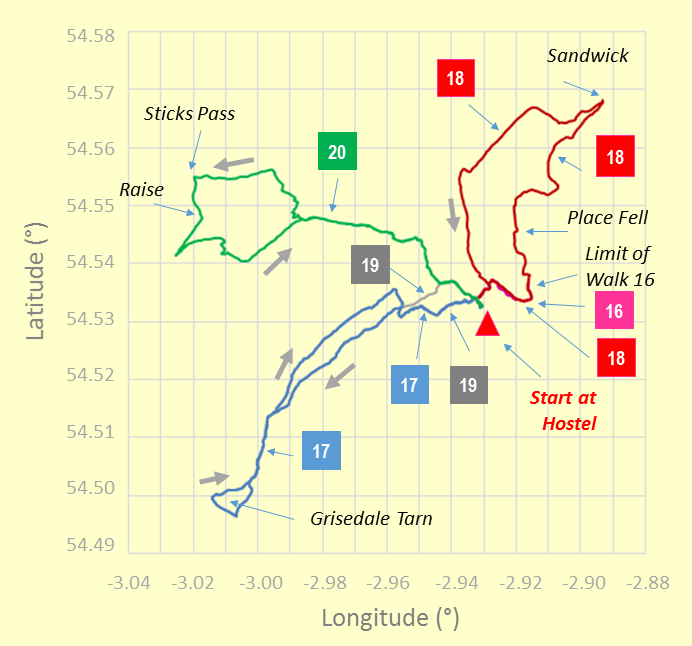
All the five walks started and finished at our hostel (red triangle), which thus proved for us to be an excellent base. Stretches of some walks were shared with other walks -
for example: (a) 16 and 18, (b) 17 and 19, (c) 19 and 20.
The map grid scales translate to 0.645 Km per 0.01° longitude and 1.112 Km per 0.01° latitude,
all when using 6371.0 Km as the volumetric mean radius of the earth!
Interestingly, near London, it is 0.690 Km per 0.01° longitude, so the latitude of the Lake District compared to London is already noticeable
in the map longitude angle-to-distance conversion factors.
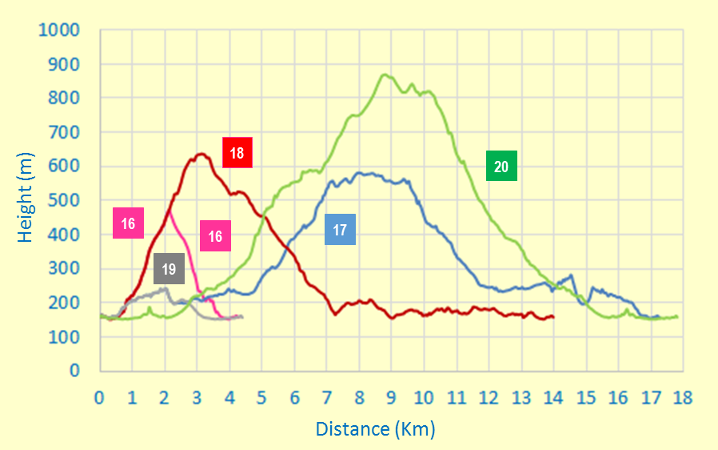
This diagram gives heights and distances for all five walks. Our hostel was already at 185 metres above sea level. Of course, we reached our maximum height on Monday's walk to Raise, with Saturday's walk to Place Fell and Friday's walk to Grisedale Tarn coming second and third in the maximum height stakes. Note that, as above, some stretches of some walks were partly shared with some stretches of other walks.
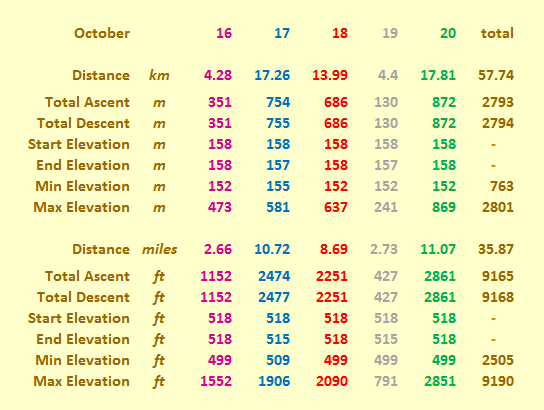
Here are some "vital statistics" in metric and imperial units. Of course, the total ascent usually exceeds the maximum height; I'd suspect things, if the reverse transpired!
Start and end elevations should be the same, but as mentioned, my plotting is not perfect, producing results that should be seen as being of an indicative nature!
The total distance, as always measured on a conceptual "flat" plane at mean sea level,
was 57.74 Km or 35.87 miles.
The total ascent was 2.793 Km or 1.735 miles.
Quite respectable for a CLOG extended weekend away!
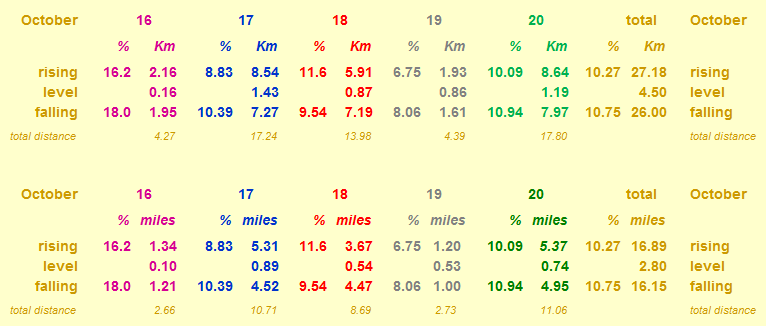
And here, for the numerical fun of it, are the average gradients we overcame on each of our five walks, together with the resultant average gradients over the five days. Each of the gradients is averaged over the distance given, with level stretches having rises less than ± ½ metre.
The average gradients for walk 16 are of course steeper than those for walk 18 to Place Fell, because walk 16 covers only part - the steepest part - of walk 18.
By comparison, Hertfordshire County Council recommends that its roads should not have longitudinal gradients of more than 5% and one of the steepest adhesion railways in the world, in Austria, has a maximum gradient of 11.6%.
And why not have a look at the gradients on our recent Capel Curig visit?
Contact, Copyright & Please Read Me!
Please click here for more general logistical and copyright considerations relating to this page and other pages on this web site. Thank you!
Eric Scharf
Latest Version: 2014-10-25 @12:04
SAGAX REX HANC RETIS ORBIS PAGINAM PINXIT ANNO MMXIV.