  
|
Autumnal Essex MAPS & HEIGHTS November 2019 |
 
|
| Where ? Walks Map Heights Figures Weather Timing Tracks Finally Read Me |
Features of Our Walks from Wickford
Our walks you see described here are both circular and both start and finish at Wickford Station. This was done to make it easy for those relying on public transport and coming from London or anywhere close to a railway station. Both walks are identical apart from a short section in and around Downham Village, and both walks are about 9½ miles long. These walks counter the myth that Essex is entirely flat. Indeed, these walks have some interesting undulations and associated viewpoints towards the south, the west and the east.
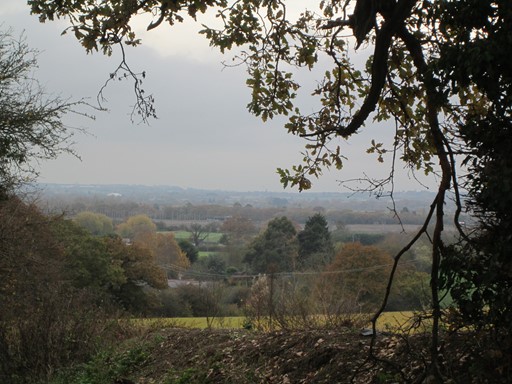
Going towards the Grange, we get this view to the south from the bridleway.
Now prepare ye for some plots and graphs. Not too overwhelming, but hopefully quite interesting! You will see here:
- Where is Wickford?
- An Outline Map of Our Walks
- Height Profiles of Our Walks
- Some Facts and Figures
- Weather, Ground Conditions & Signposting
- Timing & Speed
- Track Files
- And Finally
Where is Wickford?
Wickford is in the county of Essex and is just under 30 miles in an approximate east north east direction from the centre of London, as the crow flies. The centre of London is officially taken as the intersection of The Strand, Whitehall and Cockspur Street. This intersection is often referred to as Charing Cross, not to be confused with the nearby Victorian Eleanor Cross itself, nor the station in front of which the cross stands. The detailed figures, for the fun of it, are as shown below.
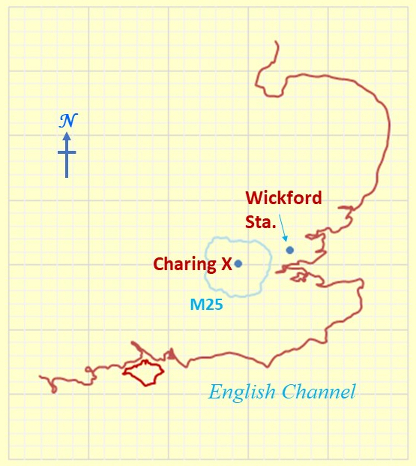
Here you see a "sketch" of South East England, showing the M25
and the locations of Wickford Station and Charing Cross.
Vertical Axis: Degrees Latitude: 50.0 to 53.5.
Hrizontal Axis: Degrees Longitude: 3 west to 2 east.
If you espouse the quantitative in life, we have some numbers for you! What are these "great circle distances"? If you haven't met these before, I'll try, in my humble way, to give a little bit of an explanation. A great circle is the largest circle that can be drawn on the surface of a given sphere. As a consequence, its centre coincides with the centre of the sphere. We assume the earth to be spherical. It makes our maths "reasonably" easy and gives us a maximum error of about 0.1% in our distance values. Not that much really! Can't complain!
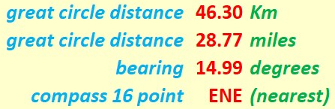
If you espouse the quantitative in life, here you duly see some numbers!
Our "straight line" distances are actually "great circle" distances on the earth's surface. Indeed, we can speak of the distances as the "hypothetical crow" (cornix hypothetica) flies.

Cornix Hypothetica, our hypothetical crow,
isn't any old bird, as we should know.
Cornix Hypothetica! Many miles for us you go,
with many a "straight line" o'er Earth to show.
Outline Map of Our "Circular" Walks from Wickford
The walks you see described here are both circular based on Wickford Station. Both walks are identical apart from a short section in and around Downham Village, and both walks are about 9½ miles long. The first walk (A) is coloured dark red in the map below and the deviation in the second version (B) of the walk is coloured green. For clarity, the same colours are used for the height profiles and the summary figures (Walk facts and figures) you'll find further below. The "silver arrow" in the map indicates the direction of the walks.
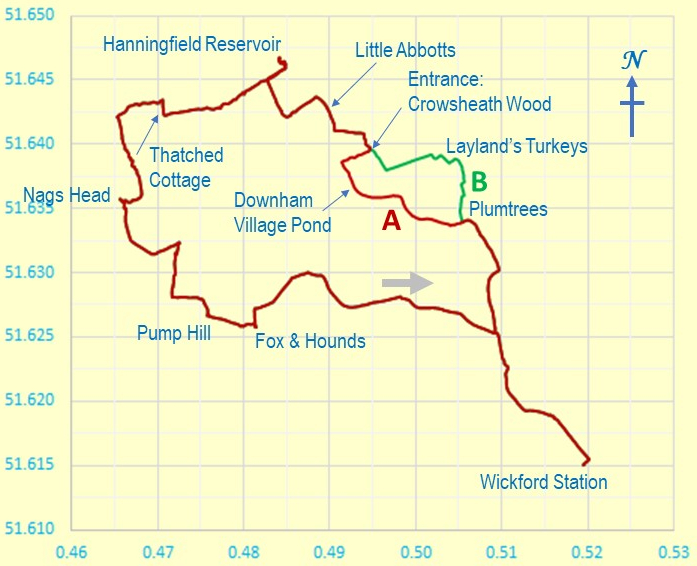
Outline Map of Our Walks
Y and X axes are in degrees latitude and longitude respectively.
The map grid scales translate to 1.112 Km per 0.01° latitude and a mean of 0.690 Km per 0.01° longitude, all when using 6371.0 Km as the volumetric mean radius of the earth - as per the WGS84 standard! In Scales, in the Lake District, the longitude scale is less (as expected), with a mean of 0.644 Km per 0.01° longitude; in fact, in doesn't take too much brain power to conclude that in Scales the distance is 26 metres per 0.01° longitude less than in Wickford!
Because we don't live on a flat earth - unless you are a convinced "flat-earther" - maps are inevitably a distortion of what is. In other words, it's all a matter of mapping a curvaceous surface onto a flat surface. We don't want to carry curvaceous representations of the terrain on our walks, do we? In our case, the northern length of our map grid is stretched out by an extra 0.09 %, to make it the same on the page as the length of the southern part of our map grid. Not that much for hiking purposes really! Can't complain.
Height Profiles of Our Walks
Here we look at (1) the total ascent, (2) shading on the height profiles, and (3) definition of mean sea level.
- Total Ascent. It's of course fine to say that we reached about 246 or 243 feet above sea level, but what's the significance of that? Probably, of greater interest when it comes to considering personal achievements, is the total ascent (which usually requires greater effort than the descent). The first walk with the slightly higher maximum height reached, actually has the lower total ascent of the two walks. On the basis of total ascent, the first walk is marginally easier than the second walk!
- Shading Effect. The second walk, at 9.49 miles, is marginally shorter than the first whose length is 9.50 miles. This explains the shading effect in the height profile after about 4.3 Km into each walk.
- Mean Sea Level. The heights are of course those above the mean sea level as defined by the OS® reference at Newlyn in Cornwall.
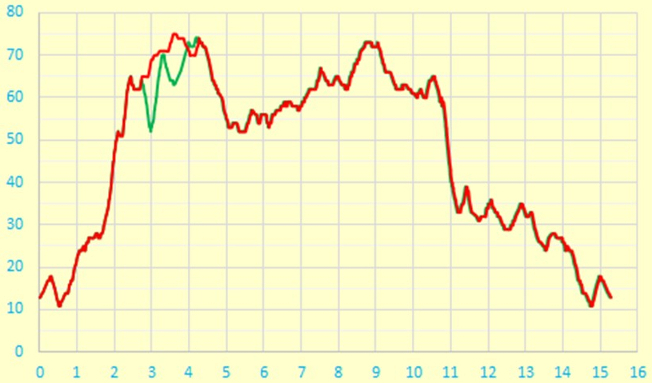
Height Profile
X and Y axes are in units of metres and kilometres respectively.
Some Facts and Figures
Here are some "vital statistics" in metric and imperial units. Of course, as mentioned above, the total ascent exceeds the difference between maximum and minimum elevations; I'd suspect things, if the reverse transpired!
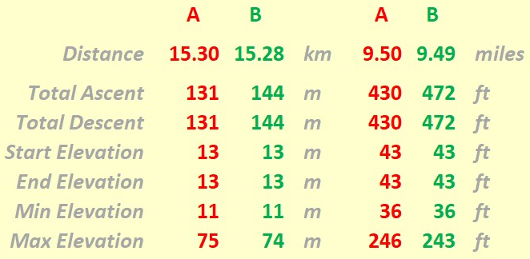
"Walk facts and figures"
Each route was derived using my GPS (Garmin®). Hence, the distances for each walk may include some walking at about at places of interest; therefore, for each walk, these distances may be up to about 0.5 Km above "true"! However, all the results shown on this page are for indicative purposes and do not aspire to the heights of scientific accuracy, however precise the results may be!
Weather, Ground Conditions & Signposting
On any walk there are considerations which are very real but tantalizingly out of ready reach of those who wish to espouse a numerical approach to many of life's activities. Here are three considerations for starters.
- Weather: It stayed dry from November 6 through November 12 - no precipitation or snow! The day-time temperatures encouraged walking. It was sunny with a few clouds - again, just nice for walking. The table below is derived from the
"Accuweather" web site.
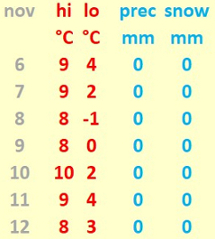
"Weather"
- Ground Conditions: Some places still had the muddy left-overs from previous wet weather. Hence, walking boots were necessary.
- Signposting: Many paths were suitably signposted, but as always, if you are new to these walks an OS® map is very helpful!
Timing and Speed
It's one thing to discuss the terrain over which we walk. It's quite another to ask how we personally respond to walking over that terrain. There are a number of considerations, of which timing and speed can be taken as starting points.
Taking the length of each walk as 9.5 miles and an average walking speed of 2.5 mph, we get a time of 3.8 hours, and a walking speed of 2.0 mph would yield 4.75 hours. So, 4 to 5 hours would be a reasonable estimate. Add at least 1 hour for visits to one or both hostelries. All doable on an autumn walk in the first half of November.
Of course, if you timed your walk, you could see how fast you walked. However, I think that these walks should really be more for enjoyment than for trying to reach a given physical fitness aim.
Track Files
If you are keen to see our walk superimposed on an Ordnance Survey® (OS) map, then you can use the following files to do so. The data in these files were recorded by my GPS (Garmin®). The data are based on WGS84. Of course, for copyright reasons, I do not show the OS-based maps here. Furthermore, the plot may also include some walkabouts in hostelries and sightseeing places; hence there may be a slight over estimation of the length of a walk by anything up to 1 Km.
Here are the two Wickford walks: A through Downham and B past the Turkeys.
And Finally - a Matter of Practicality
Any map is an approximate representation of what is. Practicality and scale are relevant considerations. We are not dealing with a planning application calling for detailed spatial descriptions of intricate boundaries. For us in the hiking community, the degrees of accuracy and precision should be just enough to give us useable and helpful knowledge of the terrain about us and beneath our feet. I hope my humble endeavours on this page are in this respect interesting for, and useful to, you my reader!


Eric Scharf
Original: 2019-12-04 @11:30
Latest Update: 2019-12-04 @11:30
SAGAX REX HANC RETIS ORBIS PAGINAM PINXIT ANNO MMXIX.
© Eric Scharf 2019