 |
CLOG - Heidelberg 2019 MAPS & HEIGHTS 08 - 15 September |
 |
| Where ? Places Walks Map Heights Figures Weather Signs Timing Tracks Finally Read Me |


Features of Our Four Walks in Odin's Forest
Heidelberg is the gateway to Odin's Forest. Lots of coniferous and deciduous forest and of course the River Neckar provide the major focus in the landscape. Every now and then castles and mediaeval towns seemed to pop up from the forest. We did four walks of about 10 to 12 miles each, based on Heidelberg and Neckargemuend and using public transport as appropriate.
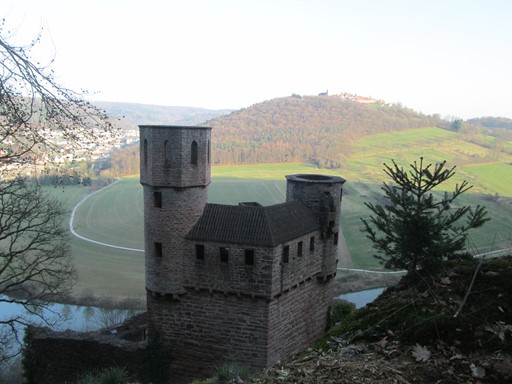
One of our walks took us to the four castles in Neckarsteinach.
From one of the castles we could look across the river to the mediaeval erstwhile fortified town of Dilsberg, which we had visited about two hours before.
Apart from some low cloud on Monday, we had good walking weather for every day. Not too hot or cold. Plenty of sunshine with only some modest amount of cloud.
Now prepare ye for some plots and graphs. Not too overwhelming, but hopefully quite interesting! You will see here:
- Where is Heidelberg?
- Places we visited
- An Outline Map of Our Walks
- Height Profiles of Our Walks
- Some Facts and Figures
- Weather, Ground Conditions & Signposting
- Timing & Speed
- Track Files
- And Finally
Where is Heidelberg?
Heidelberg is known for its University and also its history with connections to the English crown. It is the gateway to Odin's Forest on whose eastern edge it lies. Heidelberg is also quite close to Strasbourg in France, with Basle in Switzerland moderately close to the south. Distance-wise, Brussels is about half way between London and Heidelberg.
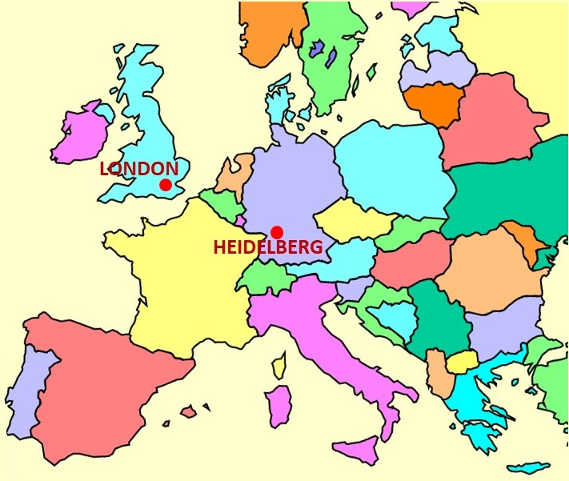
Here you see an outline map of Western Europe,
showing the approximate locations of Heidelberg and London.
This "map" is from the Microsoft® PowerPoint® Clip Art Library originally supplied with versions of MS_Office®.
If you espouse the quantitative in life, we have some numbers for you! What are these "great circle distances"? If you haven't met these before, I shall try, in my humble way, to point to a little bit of an explanation below.
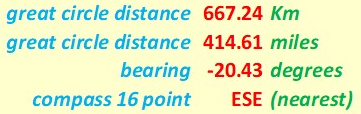
If you espouse the quantitative in life, here you duly see some numbers!
London and Heidelberg are a little bit over 400 miles apart.
That's only a bit more than the distance of the train journey from Euston to Glasgow!
Our "straight line" distances are actually "great circle" distances on the earth's surface. We assume the earth to be spherical, which is not far off the mark. Assuming the earth to be a sphere gives us a maximum error of about 0.1% in our distance values. Not that much really! Can't complain! (For more nice details see distance). Indeed, we can speak of the distances as the "hypothetical crow" (cornix hypothetica) flies.
Cornix Hypothetica, our hypothetical crow,
isn't any old bird, as we should know.
Cornix Hypothetica! Many miles for us you go,
with many a "straight line" o'er Earth to show.
Places we Visited
Here you see some of the places (in dark red) which we visited for sightseeing. Many of us flew into Frankfurt or Stuttgart Airports. We all stayed in the old part of Heidelberg (Heidelberg Altstadt). Our walks were within a 25 Km radius of our residence in Heidelberg - we were, after all on the doorstep of a great area for walks and hikes!
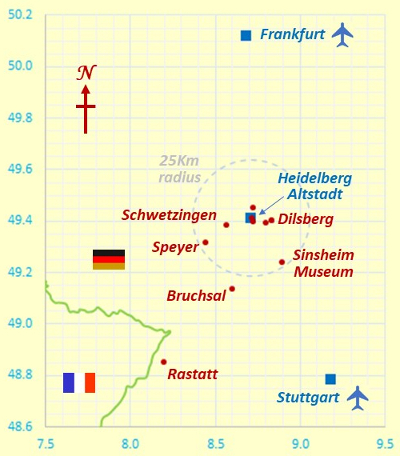
Some of the places we visited.
Y and X axes represent degrees latitude and longitude.
Outline Map of Our Four Walks in Odin's Forest
There were four walks on our visit to Heidelberg. While Heidelberg was our base, two walks started further east, upriver, at Neckargemuend. Our walks were on both sides of the Neckar and the good local transport enabled us - where appropriate - to get to the start and from the finish of walks. Sonja led Wednesday's walk and Eric the other three. On Sonja's walk some of us also enjoyed a river trip by returning to Heidelberg from the landing stage at Neckargemuend.
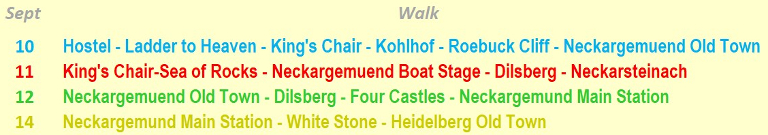
Our Walks in Overview
Colour and Date Each walk is given a colour and the date. For simplicity, the same colours and dates appear in "bus map fashion" in the map and the height plots below. Because of the way the plotter of my spread sheet works, where two or more walks overlap, the latest walk is plotted over earlier walks. Here you see the fore-shortened version of Sonja's walk (11). Her full walk continued via Dilsberg to Neckarsteinach, with an estimated total distance of about 12 miles; some of us would cover the route from Neckargemuend, via Dilsberg and Neckarsteinach to Neckargemuend on the following day (green 12).
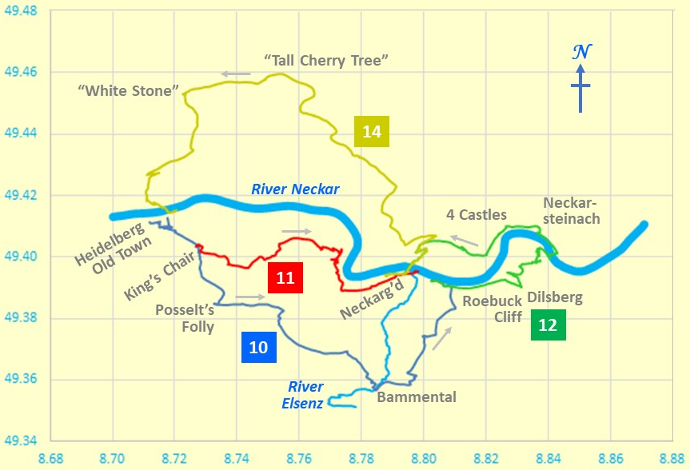
Outline Map of Our Walks
Y and X axes are in degrees latitude and longitude respectively.
Map Scales The map grid scales translate to 1.112 Km per 0.01° latitude and a mean of 0.723 Km per 0.01° longitude, all when using 6371.0 Km as the volumetric mean radius of the earth - as per the WGS84 standard! In Scales, in the Lake District, the longitude scale is less (as expected), with a mean of 0.644 Km per 0.01° longitude; in fact, in doesn't take too much brain power to conclude that in Scales, in the Lake District, the distance is 79 metres per 0.01° longitude less than in Heidelberg! This seems to fit in with the notion that we are all attached to something which is a close-to-spherical globe! So flat-earthers beware!
Map Distortion Because we don't live on a flat earth - unless you are a convinced "flat-earther" - maps are inevitably a distortion of what is. In other words, it's all a matter of mapping a curvaceous surface onto a flat surface. We don't want to carry curvaceous representations of the terrain on our walks, do we? In our case, the northern length of our map grid is stretched out by an extra 0.29 %, to make it the same on the page as the length of the southern part of our map grid. Not that much for hiking purposes really! Can't complain.
Height Profiles of Our Walks
It's of course fine to say that we reached 568 m above sea level (which is more or less the height of the "King's Chair", but what's the significance of that? Probably, of greater interest when it comes to considering personal achievements, is the total ascent (which usually requires greater effort than the descent). On the four walks shown here, the total ascent varied from one walk to the next, but the maximum ascent recorded was just over 0.9 Km for our walk on Saturday, September 14.
As a naturally inquisitive mortal, you are no doubt wondering about the data references for the heights above sea level. Well, the Ordnance Survey® in the UK uses the "Ordnance Datum Newlyn" (Newlyn as in Cornwall), whereas Germany's system uses "Standard Elevation Zero" which is ultimately based on the "Amsterdam_Ordnance_Datum". I find it's interesting to see how other countries do things, in this case, for us as walkers and bikers, when it comes to maps.
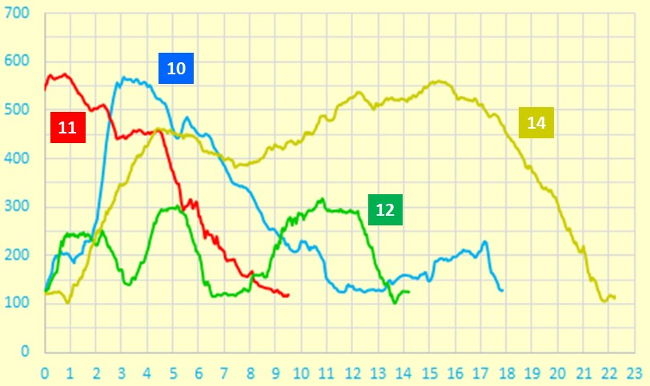
Height Profile
X and Y axes are in units of metres and kilometres respectively.
This plot uses a true origin for the vertical elevation (height) axis,
so as not to lose track of reality. What a worthy aim!
In the above height plot, we can see that the maximum height we achieved was 568 m on the "King's Chair" on walks 10 and 11. The two highest "humps" on walk 12 represent (1) Dilsberg with its Castle (approaching 300 m) and (2) the terrain near the "four castles" opposite to, and on the other side of the Neckar River from, Dilsberg. The highest point on walk 14 (Saturday's walk) was about 550 m on the "White Stone"; the height was just below that of the "King's Chair".
Some Facts and Figures
Here are some "vital statistics" in metric and imperial units. The total length of the walk is measured on a conceptual "flat" plane at mean sea level, WGS84 style. Of course, as mentioned above, the total ascent exceeds the difference between maximum and minimum elevations; I'd suspect things, if the reverse transpired!
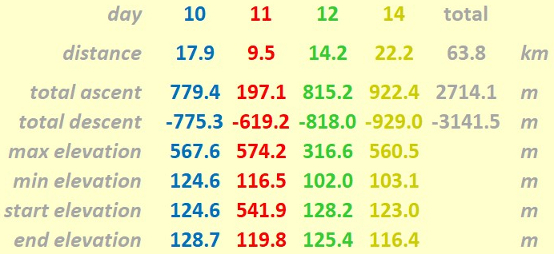
"Walk facts and figures (metric)"
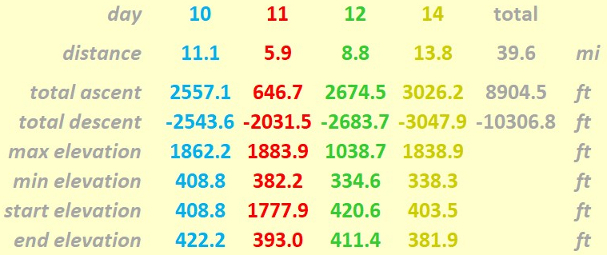
"Walk facts and figures (imperial)"
Each route was mainly derived using my GPS (Garmin®). Hence, the distances for each walk will include some walking at about at places of interest; therefore, for each walk, these distances may be about ½ Km above "true". However, all the results shown on this page are for indicative purposes and do not aspire to the heights of scientific accuracy, however precise the results may be!
Weather & Ground Conditions
We can be very pleased with our weather. Apart from the Monday with some low cloud, we had sunshine (S) or sun with a few clouds (SC), practically the whole time on all our full days Monday 9 to Saturday 14. (Any rain (R) on our arrival was soon forgotten!) See our pictures on the previous pages! There was no real heatwave. Just right for all the walking, sightseeing and biking that we were able to fit into six full days.
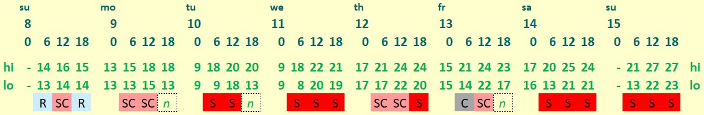
We had sunshine (S) or sun and some cloud (SC) practically all the time.
In this "weather map", each day is divided into four intervals of 6 hours each,
and high and low temperatures are in °C.
For completeness (!!), C = cloud, R = light rain, n = N/A,
but far more relevant, were S = sun, SC = sun and cloud!
While I used the first link below (timeanddate.com) to compile the weather data in the table above, all four links and information may interest you, the reader.
- Actual Weather Data
Heidelberg, weather for each day of the month over the past ten years
(scroll to "select month" on the right of page).
Sunrise & Sunset for September 2019. - Weather Averages
Heidelberg, Germany: Annual Weather Averages
Climate & Weather Averages in Heidelberg - Ground Conditions: The clement weather of the previous two weeks prior to our visit meant that there was hardly any mud on our walks.
Path Signposting
There are three signposting systems in place: one aimed at bikers, one at walkers and one aimed at "tourists", which probably include cyclists, walkers and tourists! We were really spoilt for choice. Added to that, many of us could also rely on "prior knowledge", and on maps and on smartphones. So, no excuse to get lost!! And we didn't get lost!
- Cyclists For cyclists there were, at regular intervals, clear, standard style, signposts giving distances (e.g. 1 to 10 Km) to nearby destinations and at the same time, giving on each signpost, (1) the height above sea level, using "Standard Elevation Zero", and (2) the location in "UTM" coordinates.
- Walkers. The above information was useful for walkers as well, but they could also refer to coloured signs indicating particular paths. The markings have been maintained since 1889 (eight years before Queen Victoria's Diamond Jubilee) by the "Odin's Forest Club". See, albeit in the local lingo, the following:
- Tourists. "Path Sign Stones (Wegweisersteine)" were set up in the forests around the Heidelberg area, for the "benefit of tourists". A decision was made in 1884 for "not-for-profit" organizations to set up these stones, the first stone dating from 1887. The 770th stone was donated by the "Heidelberg Paragliding Club" and erected on 22th April 2016. You'll find these nicely "engraved " stones all "over the place" in Odin's Forest.
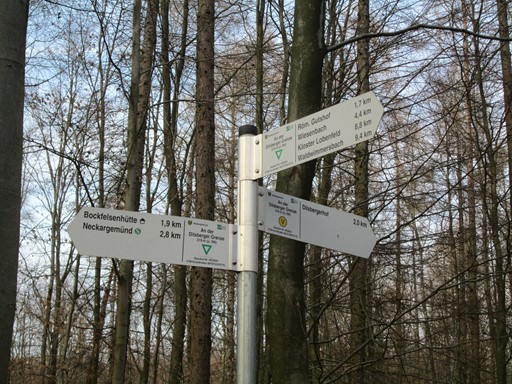
Distances, altitudes and location in UTM coordinates.
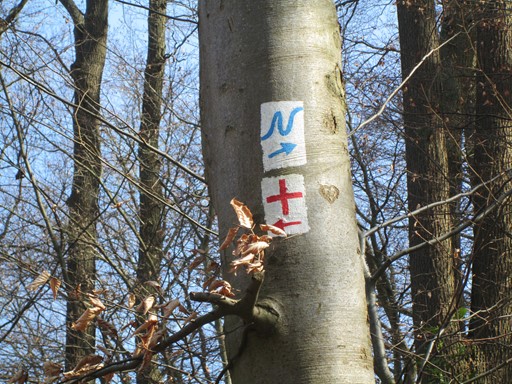
Signs indicating given walking routes.
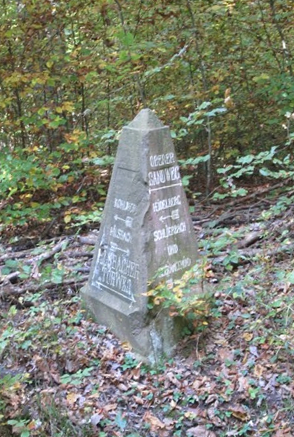
Typical "Path Sign Stone".
Timing and Speed
It's one thing to discuss the terrain over which we walk. It's quite another to ask how we personally respond to walking over that terrain. There are a number of considerations, of which timing and speed can be taken as starting points. Knowing the total distance covered in the walk and time spent actually walking (i.e. not stopping for lunch or sightseeing), you obviously can determine the speed, which typically is about 2½ mph for a walk on flat terrain, reducing to (e.g.) 1½ mph on a more challenging terrain. I probably would not find too many takers for this information were I to calculate it accurately and precisely for each of the four walks described here!
Track Files
Here you download the GPX files for each of our four walks on 10, 11, 12 and 14 September respectively. You can then display the walks using applications such as:
The data in these files were recorded mainly by my GPS (Garmin®), with some hand-plotting in places. The data are based on WGS84. Each plot may also include some walkabouts in hostelries and sightseeing places on the walk itself; hence there may be a slight over-estimation of the length of a walk by perhaps 0.5 Km. Of course, for copyright reasons, I do not show the actual maps here.
And Finally - a Matter of Practicality
Any map is an approximate representation of what is. Practicality and scale are relevant considerations. We are not dealing with a planning application calling for detailed spatial descriptions of intricate boundaries. For us in the hiking community, the degrees of accuracy and precision should be just enough to give us useable and helpful knowledge of the terrain about us and beneath our feet. I hope my humble endeavours on this page are in this respect interesting for, and useful to, you my reader!
Eric Scharf
Original Version: 2020-04-28 @12:16
Latest Update: 2020-06-22 @10:24
SAGAX REX HANC RETIS ORBIS PAGINAM PINXIT ANNO MMXX.
© Eric Scharf 2020